标签:全局 系统 cal 比较 sel sch family 包含 iso
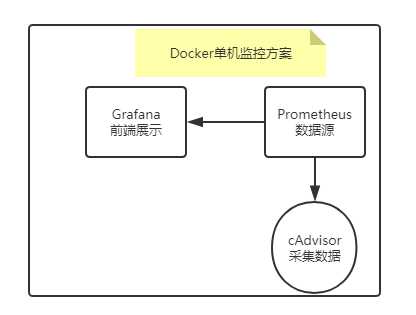
上一篇文章我们已经学习了比较流行的cAdvisor+InfluxDB+Grafana组合进行Docker监控。这节课来学习Prometheus+cAdvisor+Grafana组合。
cAdvisor是专门用来采集数据的工具,也是google公司的一款开源产品,Grafana则是前端展示,支持多种数据源,定制非常灵活。而prometheus则作为数据源。
整体架构图如下:
Prometheus(普罗米修斯)是一个最初在SoundCloud上构建的监控系统。自2012年成为社区开源项目,拥有非常活跃的开发人员和用户社区。为强调开源及独立维护,Prometheus于2016年加入云原生云计算
基金会(CNCF),成为继Kubernetes之后的第二个托管项目。
官网:https://prometheus.io
github地址:https://github.com/prometheus
2、Prometheus 特点
• 多维数据模型:由度量名称和键值对标识的时间序列数据
• PromSQL:一种灵活的查询语言,可以利用多维数据完成复杂的查询
• 不依赖分布式存储,单个服务器节点可直接工作
• 基于HTTP的pull方式采集时间序列数据
• 推送时间序列数据通过PushGateway组件支持
• 通过服务发现或静态配置发现目标
• 多种图形模式及仪表盘支持(grafana)
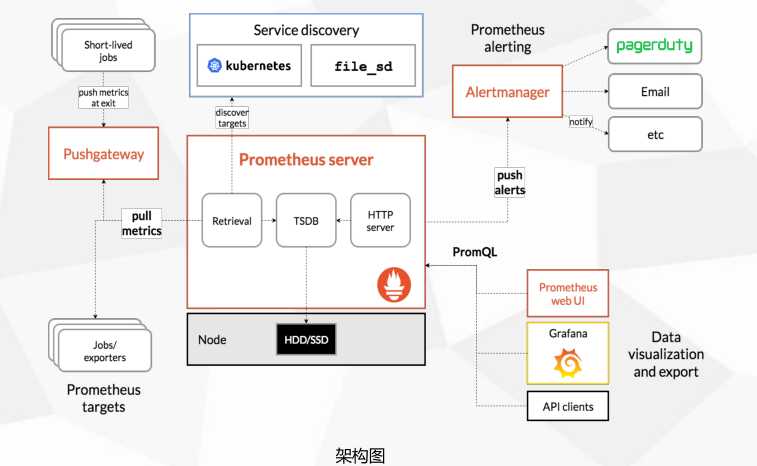
• Prometheus Server:收集指标和存储时间序列数据,并提供查询接口
• ClientLibrary:客户端库
• Push Gateway:短期存储指标数据。主要用于临时性的任务
• Exporters:采集已有的第三方服务监控指标并暴露metrics
• Alertmanager:告警
• Web UI:简单的Web控制台
实例:可以抓取的目标称为实例(Instances)
作业:具有相同目标的实例集合称为作业(Job)
scrape_configs:
- job_name: ‘prometheus‘
static_configs:
- targets: [‘localhost:9090‘]
- job_name: ‘node‘
static_configs:
- targets: [‘192.168.1.100:9090‘]
二进制部署:https://prometheus.io/docs/prometheus/latest/getting_started/
Docker部署:https://prometheus.io/docs/prometheus/latest/installation/
访问Web:http://localhost:9090
配置Prometheus监控本身:
scrape_configs:
- job_name: ‘prometheus‘
scrape_interval: 5s
static_configs:
- targets: [‘localhost:9090‘]
下面已docker部署为例:
docker run -d -p 9090:9090 -v /root/prometheus.yml:/etc/prometheus/prometheus.yml prom/prometheus
prometheus.yml
# my global config
global:
scrape_interval: 15s # Set the scrape interval to every 15 seconds. Default is every 1 minute.
evaluation_interval: 15s # Evaluate rules every 15 seconds. The default is every 1 minute.
# scrape_timeout is set to the global default (10s).
# Alertmanager configuration
alerting:
alertmanagers:
- static_configs:
- targets:
# - alertmanager:9093
# Load rules once and periodically evaluate them according to the global ‘evaluation_interval‘.
rule_files:
# - "first_rules.yml"
# - "second_rules.yml"
# A scrape configuration containing exactly one endpoint to scrape:
# Here it‘s Prometheus itself.
scrape_configs:
# The job name is added as a label `job=<job_name>` to any timeseries scraped from this config.
- job_name: ‘prometheus‘
# metrics_path defaults to ‘/metrics‘
# scheme defaults to ‘http‘.
static_configs:
- targets: [‘localhost:9090‘]
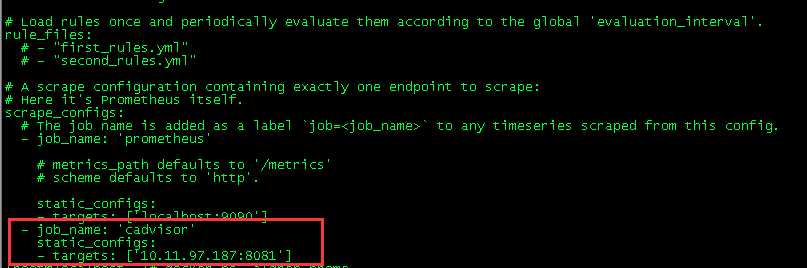
- job_name: ‘cadvisor‘
static_configs:
- targets: [‘10.11.97.187:8081‘]

这时就可以通过9090端口进行访问prometheus的页面了:
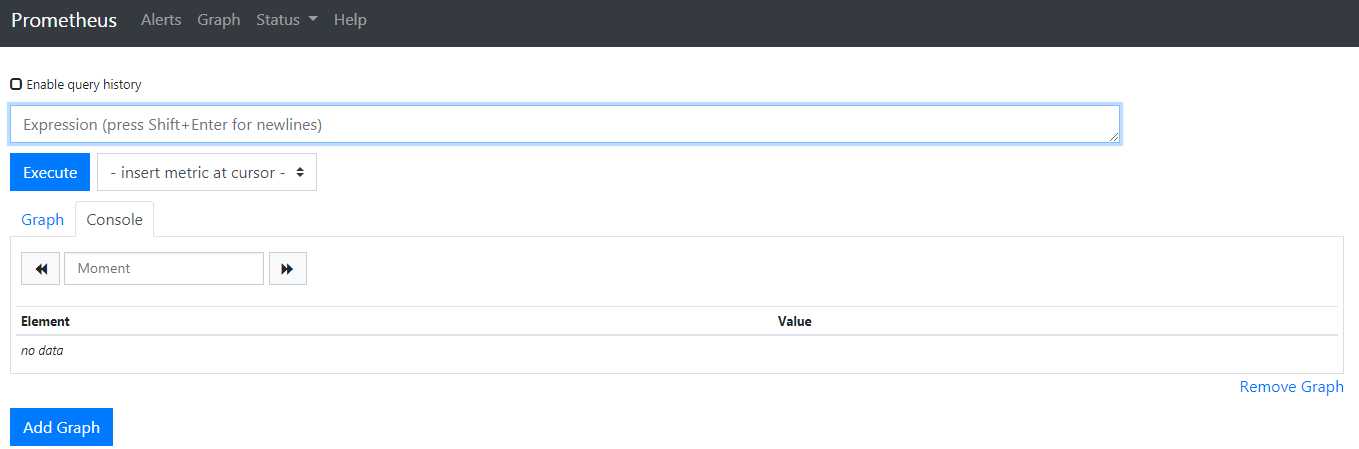
prometheus网页比较简单,包括告警、图像、以及基本信息。
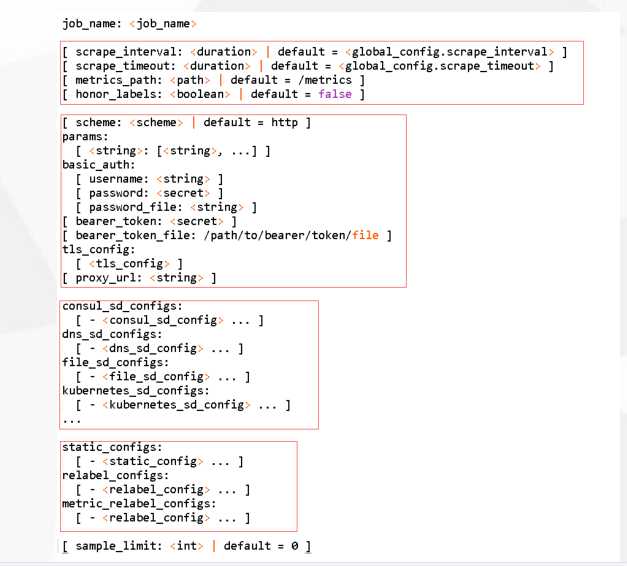
全局配置
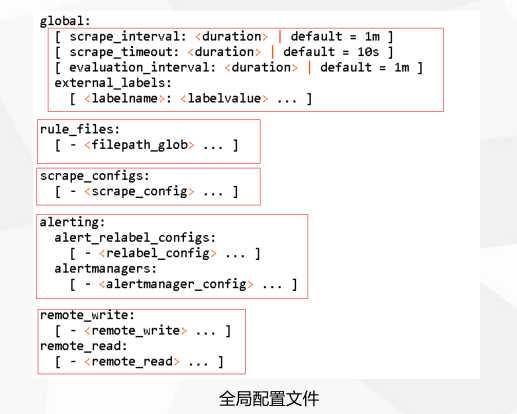
scrape配置
github地址:https://github.com/google/cadvisor
通过docker快速安装cadvisor,然后通过8081就可以访问了。
docker run --volume=/:/rootfs:ro --volume=/var/run:/var/run:ro --volume=/sys:/sys:ro --volume=/var/lib/docker/:/var/lib/docker:ro --volume=/dev/disk/:/dev/disk:ro --publish=8081:8080 --detach=true --name=cadvisor google/cadvisor:latest
访问web页面:
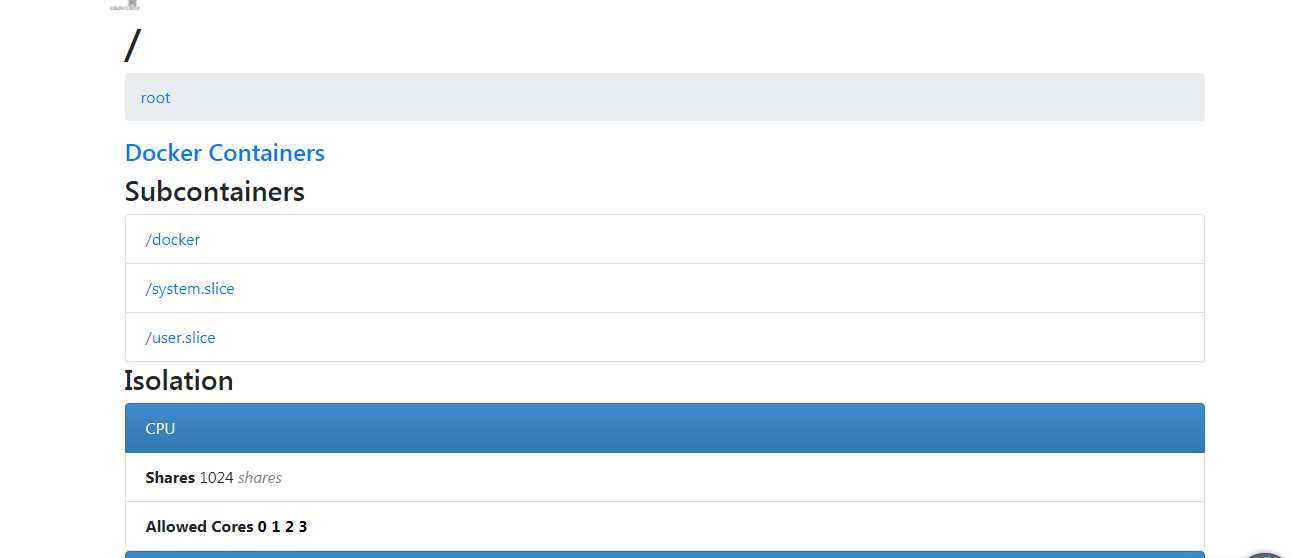
里面包含的内容非常丰富,包括docker主机上所有容器的资源监控和图表展示。
一句话安装:
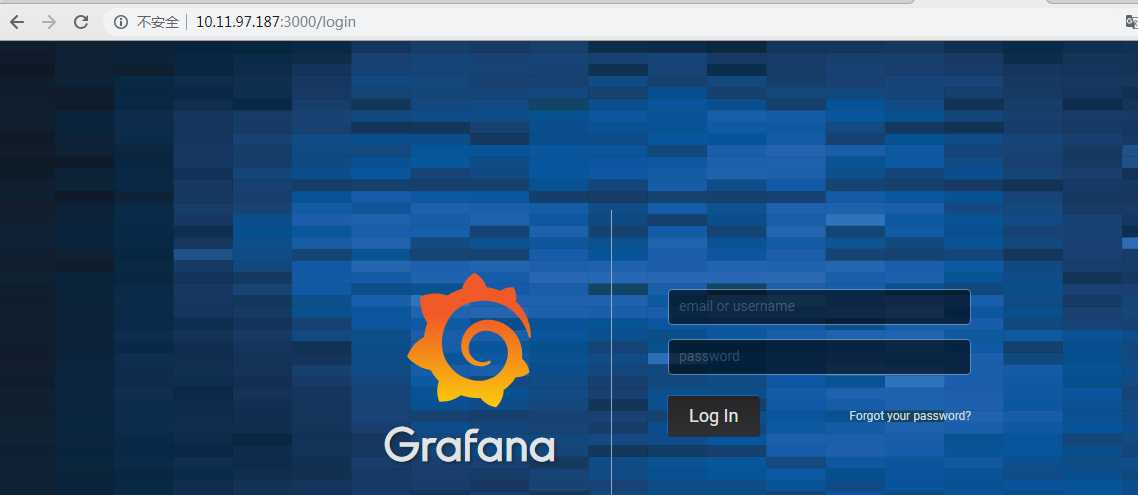
docker run -d -p 3000:3000 grafana/grafana
安装完成后,即可访问:
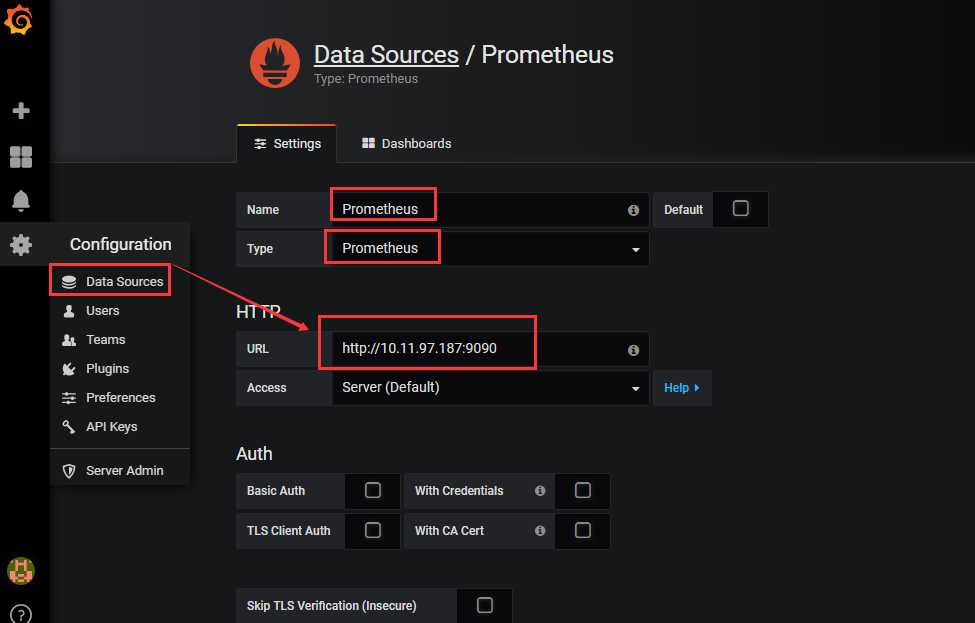
进入grafana后,点击设置,添加数据源,填写类型为prometheus以及prometheus的URL。
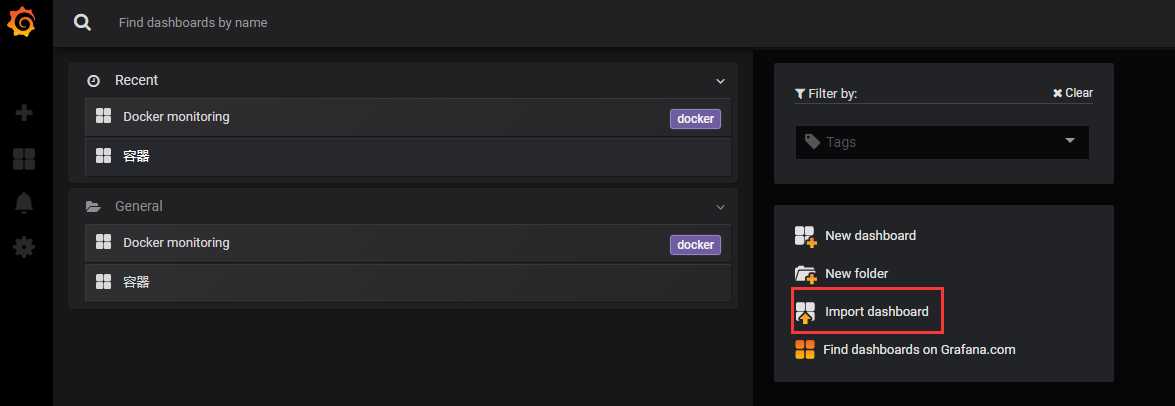
grafana里面的template(模板)可以自己制作,也可以直接从grafana官网导入。
点击Import dashaboard,我们直接从grafana官网导入模板:
输入ID号:
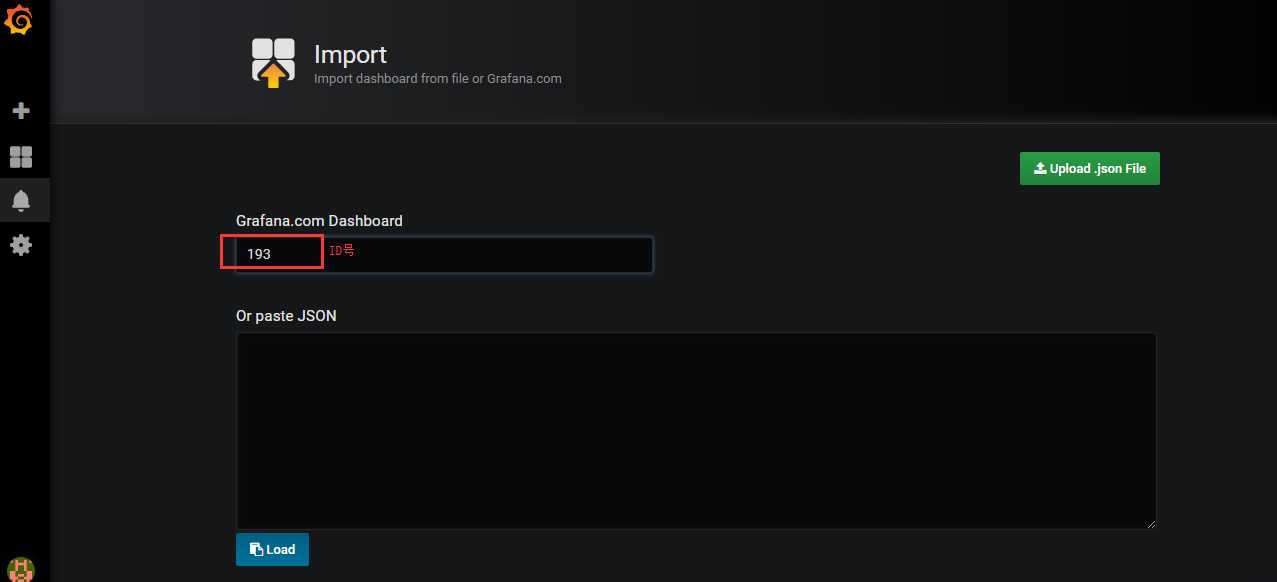
输入后回车,grafana会自动从官网查到到官网,并可以进行导入:
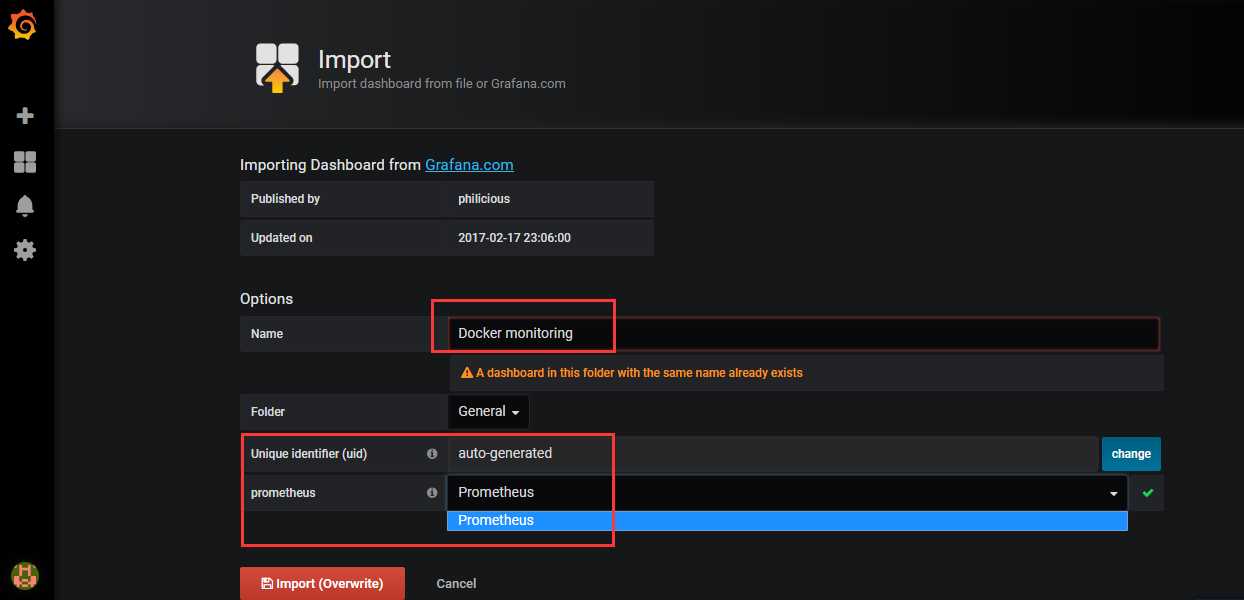
记得在prometheus里面把添加cadvisor作为采集数据源:
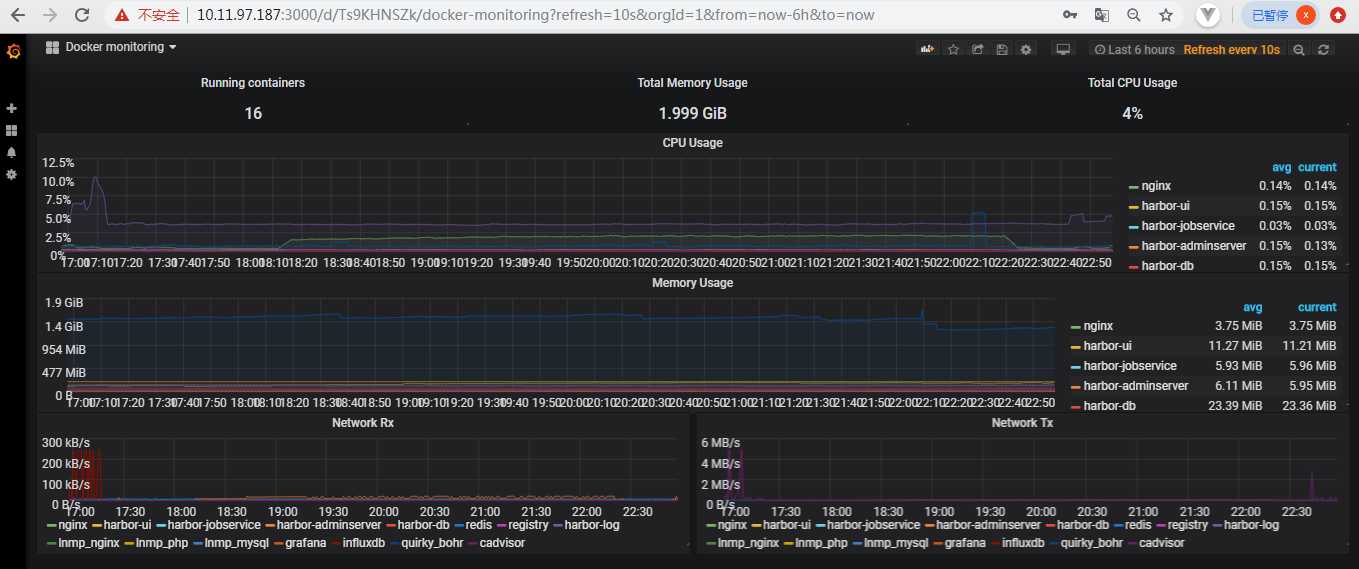
稍等片刻后,grafana里面就会有数据了:
14、Docker监控方案(Prometheus+cAdvisor+Grafana)
标签:全局 系统 cal 比较 sel sch family 包含 iso
原文地址:https://www.cnblogs.com/skyflask/p/11148702.html