标签:fonts cat mesh att ram label str 维数 pac
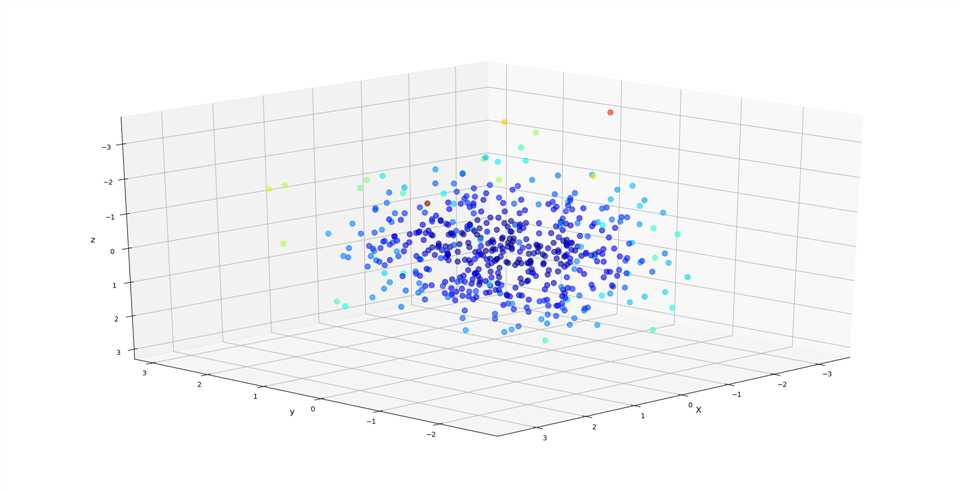
一、3D散点图
from mpl_toolkits.mplot3d import axes3d
import numpy as np
import matplotlib.pyplot as mp

n = 500
x = np.random.normal(0, 1, n)  # 一维数组
y = np.random.normal(0, 1, n)  # 一维数组
z = np.random.normal(0, 1, n)  # 一维数组

mp.figure(‘3D Scatter‘, facecolor=‘lightgray‘)
ax3d = mp.gca(projection=‘3d‘)
d = (x - 0) ** 2 + (y - 0) ** 2 + (z - 0) ** 2
ax3d.set_xlabel(‘X‘, fontsize=12)
ax3d.set_ylabel(‘y‘, fontsize=12)
ax3d.set_zlabel(‘z‘, fontsize=12)
ax3d.scatter(x, y, z, s=60, marker=‘o‘, alpha=0.6, c=d, cmap=‘jet‘)

mp.tight_layout()
mp.show()

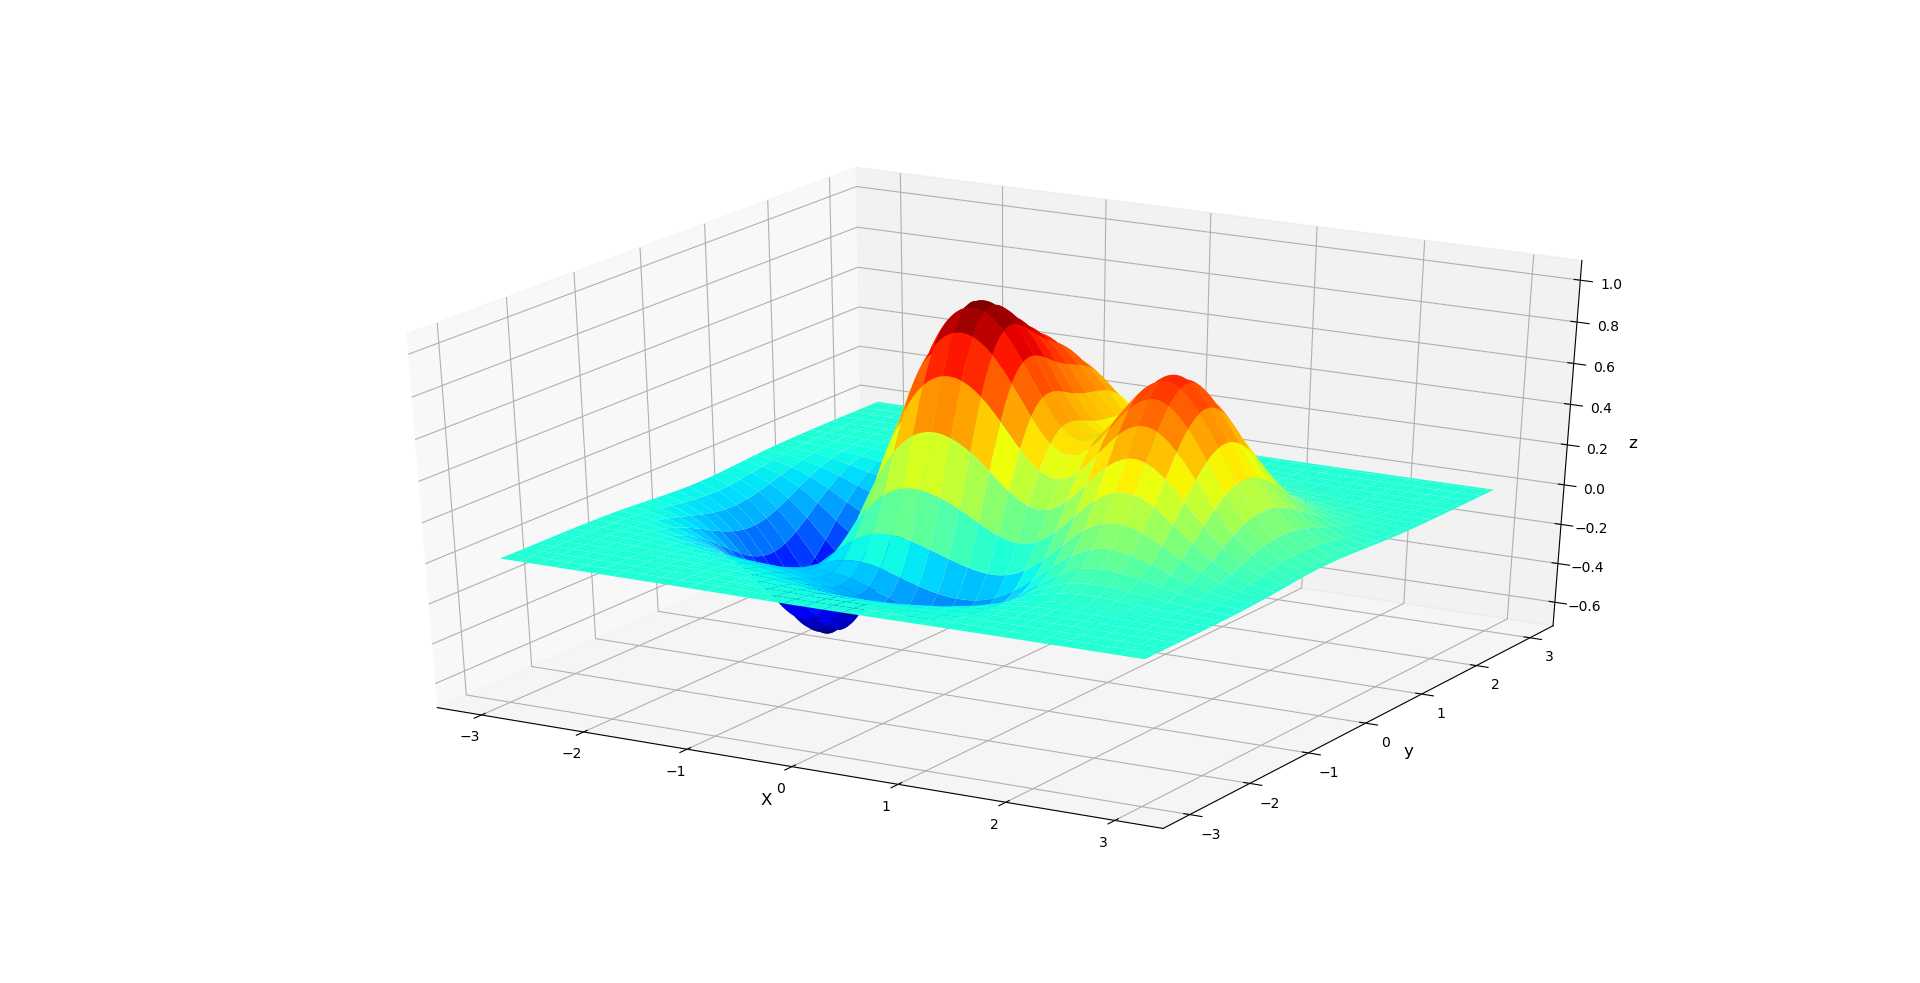
二、3D曲面图
import numpy as np
import matplotlib.pyplot as mp
from mpl_toolkits.mplot3d import axes3d

n = 1000
# x,y,z为二位数组

x, y = np.meshgrid(np.linspace(-3, 3, n), np.linspace(-3, 3, n))
z = (1 - x / 2 + x ** 5 + y ** 3) * np.exp(-x ** 2 - y ** 2)

mp.figure(‘3D Surface‘, facecolor=‘lightgray‘)
mp.title(‘3D Surface‘, fontsize=18)
mp.grid(linestyle=":")
ax3d = mp.gca(projection=‘3d‘)
ax3d.set_xlabel(‘X‘, fontsize=12)
ax3d.set_ylabel(‘y‘, fontsize=12)
ax3d.set_zlabel(‘z‘, fontsize=12)

ax3d.plot_surface(x, y, z, rstride=30, cstride=30, cmap=‘jet‘)

mp.show()

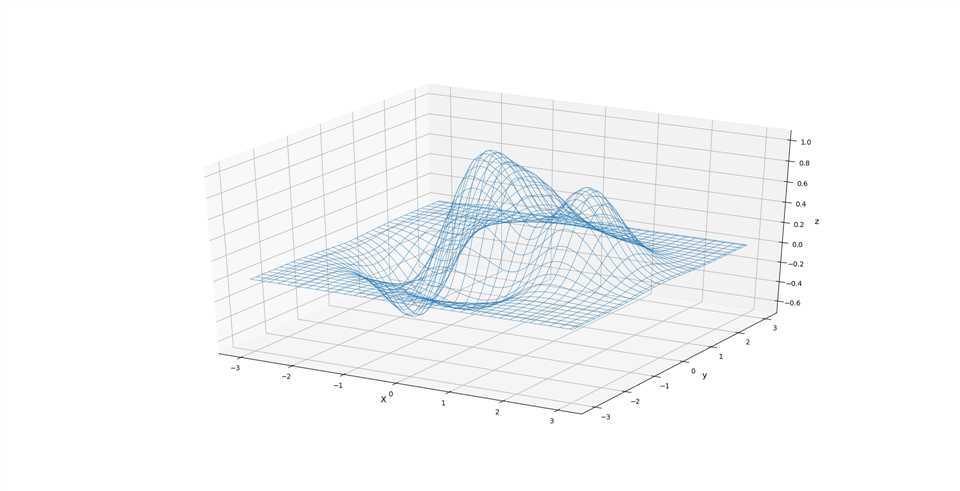
三、3D线框图
import numpy as np
import matplotlib.pyplot as mp
from mpl_toolkits.mplot3d import axes3d

n = 1000
x, y = np.meshgrid(np.linspace(-3, 3, n), np.linspace(-3, 3, n))
z = (1 - x / 2 + x ** 5 + y ** 3) * np.exp(-x ** 2 - y ** 2)

mp.figure(‘3D Wireframe‘, facecolor=‘lightgray‘)
mp.title(‘3D Wireframe‘, fontsize=18)
mp.grid(linestyle=":")
ax3d = mp.gca(projection=‘3d‘)
ax3d.set_xlabel(‘X‘, fontsize=12)
ax3d.set_ylabel(‘y‘, fontsize=12)
ax3d.set_zlabel(‘z‘, fontsize=12)

ax3d.plot_wireframe(x, y, z, rstride=30, cstride=30, linewidth=0.5, cmap=‘jet‘)

mp.show()

.
标签:fonts cat mesh att ram label str 维数 pac
原文地址:https://www.cnblogs.com/yuxiangyang/p/11156688.html