码迷,mamicode.com
首页 > 其他好文 > 详细

echart-悬浮框-初探

时间:2019-07-12 18:59:01      阅读:115      评论:0      收藏:0      [点我收藏+]

标签:obj   type   内容   info   tool   nes   turn   console   move   

今天有一个需求 是这样的

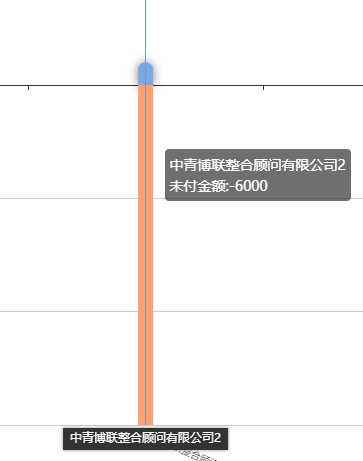
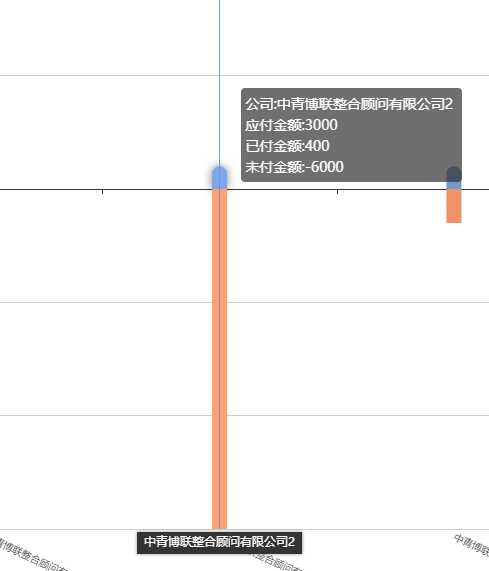
柱状图:当鼠标移到 x轴线上 显示 弹框 内容一

    当鼠标移到柱状图上 显示 弹框 内容二
技术图片技术图片


首先 鼠标移到 坐标轴线的时候 弹框显示 的开关

    xAxis: {
                    data: xAxisDatat,
                    name: ‘‘,
                    silent: false,
                    axisPointer:{
                        show:true,
                        type:‘line‘,
                        lineStyle:{
                            color:‘#7198d2‘,
                        },
                        triggerTooltip:true,//鼠标移到坐标轴线上 弹框显示
						label: {
                        	show:true,
							fontSize: 12,
							formatter:
									function (params) {
										//这里显示的是xAxis.data的内容 会显示在x轴上方 并不是需求那个弹框
										company=params.value
										return params.value
									}
						}
                        // triggerTooltip:false,
                    },
                    axisLabel:{
                        // interval: 0,// 0 强制显示所有,1为隔一个标签显示一个标签,2为隔两个
                        rotate: -25,//标签旋转角度,在标签显示不下的时可通过旋转防止重叠
                        textStyle: {
                            fontSize: 10,//字体大小
                        }
                    },
                    axisLine: {onZero: true},
                    splitLine: {show: false},
                    splitArea: {show: false}
                },

  然后 这里有两种显示方式  内容一和内容二,此时就需要判断 鼠标是在 柱状图上 还是在 坐标轴线上 

var isXLabel=true;
			myChartt.on(‘mousemove‘, function (params) {
				isXLabel=false;
				console.log(‘不在线上‘)
				getChange()

			});
			myChartt.on(‘mouseout‘, function (params) {
				isXLabel=true;
				console.log(‘在 线上‘)
				getChange()
			});

  改变弹框显示 也就是 重新渲染 mychart ,这里 需要重复渲染的原因是 数据 没有一起给到 ,

    如果 数据 比较全面 可以不重新渲染 直接在tooltip 中 进行判断 显示

    function getChange() {
                if(isXLabel){
                    if (optiont && typeof optiont === "object") {
                        myChartt.setOption(optiont, true);
                    }
                }else{
                    myChartt.setOption(optiont_, true);
                    console.log(3333)
                }
            }


下面是两个option的内容

技术图片
    optiont = {
                backgroundColor: #fff,
                legend: {
                    //data: [‘已付金额‘, ‘未付金额‘],
                    data:[
                        {
                            name:"已付金额",
                        },
                        {
                            name:"未付金额",
                        },
                        {
                            name:未付金额
                        }
                    ],
                    selectedMode:false,//取消图例上的点击事件
                    align: left,
                    left: 30
                },
               /* tooltip: {
                    formatter:function (parm) {
                        return parm.name +‘<br />‘+ parm.seriesName +‘:‘+ parm.value
                        if(parm.value < 0){
                            return parm.name +‘<br />‘+ parm.seriesName +‘:‘+ (-parm.value)
                        }else{
                            return parm.name +‘<br />‘+ parm.seriesName +‘:‘+ parm.value
                        }
                    }
                },*/
                tooltip : {
                    trigger: axis,
                    axisPointer : {
                        type : shadow
                    },
                    formatter: function (parm){
                        //应付 已付 未付 公司
                        // console.log(parm)
                        // return parm.name +‘<br />‘+ parm.seriesName +‘:‘+ parm.value
                            return 公司:+company+ <br/> +
                                    应付金额:3000 + <br/> +
                                    parm[0].seriesName+:+parm[0].data+ <br/> +
                                    parm[1].seriesName+:+parm[1].data+ <br/>

                    }
                },
                xAxis: {
                    data: xAxisDatat,
                    name: ‘‘,
                    silent: false,
                    axisPointer:{
                        show:true,
                        type:line,
                        lineStyle:{
                            color:#7198d2,
                        },
                        triggerTooltip:true,//鼠标移到坐标轴线上 弹框显示
                        label: {
                            show:true,
                            fontSize: 12,
                            formatter:
                                    function (params) {
                                        //这里显示的是xAxis.data的内容 会显示在x轴上方 并不是需求那个弹框
                                        company=params.value
                                        return params.value
                                    }
                        }
                        // triggerTooltip:false,
                    },
                    axisLabel:{
                        // interval: 0,// 0 强制显示所有,1为隔一个标签显示一个标签,2为隔两个
                        rotate: -25,//标签旋转角度,在标签显示不下的时可通过旋转防止重叠
                        textStyle: {
                            fontSize: 10,//字体大小
                        }
                    },
                    axisLine: {onZero: true},
                    splitLine: {show: false},
                    splitArea: {show: false}
                },
                yAxis: {
                    axisLabel:{
                        formatter:function (value, index) {
                            if(value<0){
                                return -value;
                            }else{
                                return value;
                            }
                        }
                    },
                    /*min:-‘dataMax‘,
                    max:‘dataMax‘*/
                    min:-getMaxMin(data1,data2),
                    max:getMaxMin(data1,data2)
                },
                grid: {
                    left: 75
                },
                series: [
                    {
                        name: 已付金额,
                        type: bar,
                        stack: one,
                        color:#7198d2,
                        itemStyle: itemStylet,
                        // barCategoryGap:10,
                        data: data1,
                        barWidth:15
                    },
                    {
                        name: 未付金额,
                        type: bar,
                        stack: one,
                        color:#f09266,
                        itemStyle: itemStylett,
                        // barCategoryGap:10,
                        data: data2
                    },
                    {
                        name: 错误金额,
                        type: bar,
                        stack: one,
                        color:#e80000,
                        itemStyle: {
                            normal: {
                                barBorderRadius: [0,0,20,20],
                            }
                        },
                        // barCategoryGap:10,
                        data: data3
                    }
                ]
            };
            var optiont_ = {
                backgroundColor: #fff,
                legend: {
                    //data: [‘已付金额‘, ‘未付金额‘],
                    data: [
                        {
                            name: "已付金额",
                        },
                        {
                            name: "未付金额",
                        },
                        {
                            name: 未付金额
                        }
                    ],
                    selectedMode: false,//取消图例上的点击事件
                    align: left,
                    left: 30
                },
                tooltip: {
                    formatter: function (parm) {
                        return parm.name + <br /> + parm.seriesName + : + parm.value
                        if (parm.value < 0) {
                            return parm.name + <br /> + parm.seriesName + : + (-parm.value)
                        } else {
                            return parm.name + <br /> + parm.seriesName + : + parm.value
                        }
                    }
                },
                xAxis: {
                    data: xAxisDatat,
                    name: ‘‘,
                    silent: false,
                    axisPointer: {
                        show: true,
                        type: line,
                        lineStyle: {
                            color: #7198d2,
                        },
                        triggerTooltip: false,
                    },
                    axisLabel: {
                        // interval: 0,// 0 强制显示所有,1为隔一个标签显示一个标签,2为隔两个
                        rotate: -25,//标签旋转角度,在标签显示不下的时可通过旋转防止重叠
                        textStyle: {
                            fontSize: 10,//字体大小
                        }
                    },
                    axisLine: {onZero: true},
                    splitLine: {show: false},
                    splitArea: {show: false}
                },
                yAxis: {
                    axisLabel: {
                        formatter: function (value, index) {
                            if (value < 0) {
                                return -value;
                            } else {
                                return value;
                            }
                        }
                    },
                    /*min:-‘dataMax‘,
                    max:‘dataMax‘*/
                    min: -getMaxMin(data1, data2),
                    max: getMaxMin(data1, data2)
                },
                grid: {
                    left: 75
                },
                series: [
                    {
                        name: 已付金额,
                        type: bar,
                        stack: one,
                        color: #7198d2,
                        itemStyle: itemStylet,
                        // barCategoryGap:10,
                        data: data1,
                        barWidth: 15
                    },
                    {
                        name: 未付金额,
                        type: bar,
                        stack: one,
                        color: #f09266,
                        itemStyle: itemStylett,
                        // barCategoryGap:10,
                        data: data2
                    },
                    {
                        name: 错误金额,
                        type: bar,
                        stack: one,
                        color: #e80000,
                        itemStyle: {
                            normal: {
                                barBorderRadius: [0, 0, 20, 20],
                            }
                        },
                        // barCategoryGap:10,
                        data: data3
                    }
                ]
            };
View Code


echart-悬浮框-初探

标签:obj   type   内容   info   tool   nes   turn   console   move   

原文地址:https://www.cnblogs.com/GoTing/p/11177628.html

(0)
(0)
   
举报
评论 一句话评论(0
登录后才能评论!
© 2014 mamicode.com 版权所有  联系我们:gaon5@hotmail.com
迷上了代码!