标签:file printf matlab max enc ati alt lap tor
代码:
%% ------------------------------------------------------------------------
%%            Output Info about this m-file
fprintf(‘\n***********************************************************\n‘);
fprintf(‘        <DSP using MATLAB> Problem 8.26 \n\n‘);

banner();
%% ------------------------------------------------------------------------

c = [1, 1]; d = [1, 5, 6];        % Numerator and Denominator of Ha(s)
T = 0.2; Fs = 1/T;                % Sample interval

%[b, a] = imp_invr(c, d, T)        % digital Num and Deno coefficients of H(z)
[b, a] = mzt(c, d, T)             % digital Num and Deno coefficients of H(z)

% Calculation of Impulse Response:
%[hs, xs, ts] = impulse(c, d);
figure(‘NumberTitle‘, ‘off‘, ‘Name‘, ‘Problem 8.26 Imp & Freq Response‘)
set(gcf,‘Color‘,‘white‘);
t = [0:0.01:4]; subplot(2,1,1); impulse(c,d,t); grid on;   % Impulse response of the analog filter
axis([0,4,-0.1,1]);hold on

n = [0:1:4/T]; hn = filter(b,a,impseq(0,0,4/T));   % Impulse response of the digital filter
stem(n*T,hn); xlabel(‘time in sec‘); title (sprintf(‘Impulse Responses, T=%.2f‘,T));
hold off


%n = [0:1:29];
%hz = impz(b, a, n);

% Calculation of Frequency Response:
[dbs, mags, phas, wws] = freqs_m(c, d, 2*pi/T);             % Analog frequency   s-domain

[dbz, magz, phaz, grdz, wwz] = freqz_m(b, a);               % Digital  z-domain


%% -----------------------------------------------------------------
%%                             Plot
%%       ω = ΩT = 2πF/fs
%% -----------------------------------------------------------------

M = 1/T;                          % Omega max

subplot(2,1,2); plot(wws/(2*pi),mags*Fs,‘b‘, wwz/(2*pi)*Fs,magz,‘r‘); grid on;

xlabel(‘frequency in Hz‘); title(‘Magnitude Responses‘); ylabel(‘Magnitude‘);

text(1.4,.5,‘Analog filter‘); text(1.5,1.5,‘Digital filter‘);
运行结果:
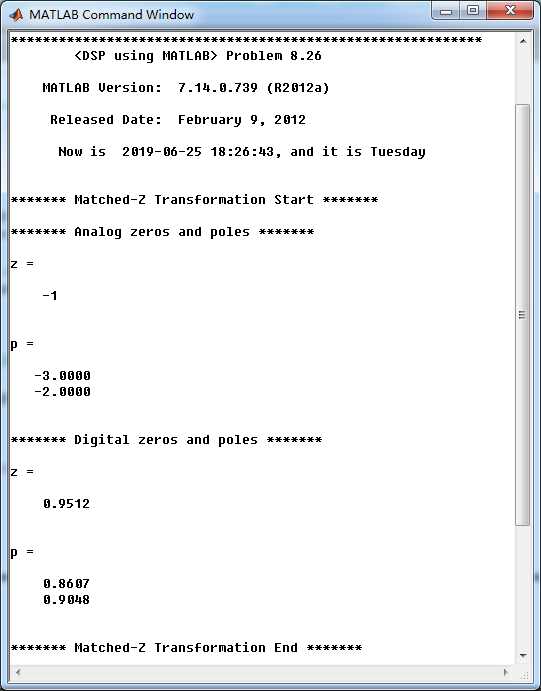
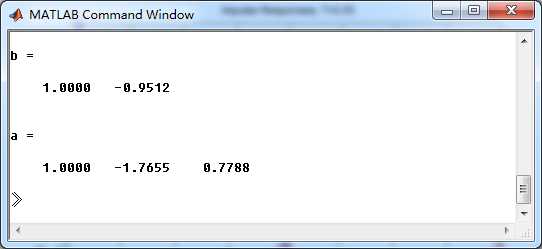
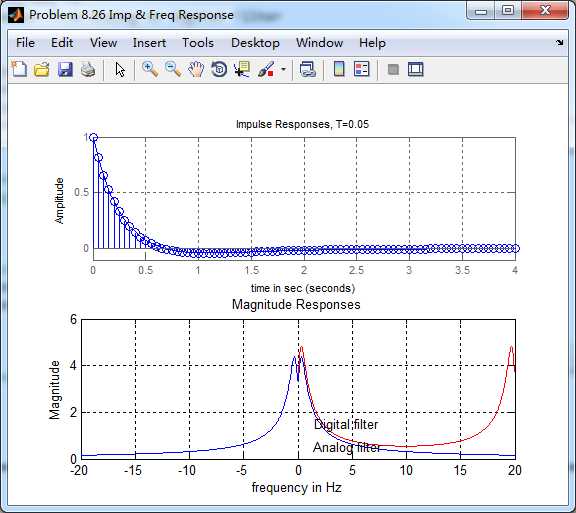
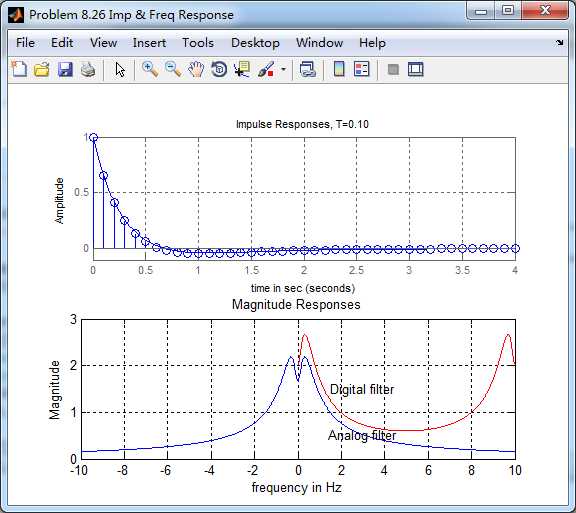
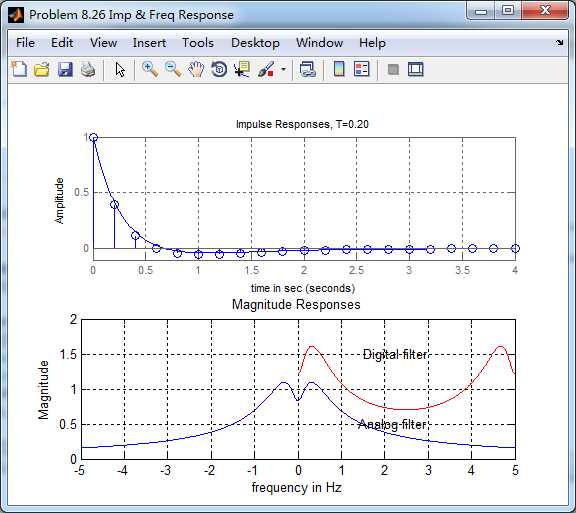
可以看出,采样间隔T越小,数字滤波器幅度响应越接近模拟滤波器。
《DSP using MATLAB》Problem 8.26
标签:file printf matlab max enc ati alt lap tor
原文地址:https://www.cnblogs.com/ky027wh-sx/p/11190632.html