标签:style blog http color io ar for sp div
Defination:
累积分布函数: The cumulative distribution function (CDF) does just that. The CDF at point x tells us what
fraction of events has occurred “to the left” of x. In other words, the CDF is the fraction of
all points xi with xi ≤ x.
 http://docs.scipy.org/doc/scipy-0.14.0/reference/generated/scipy.stats.cumfreq.html#scipy.stats.cumfreq
 # -*- coding: utf-8 -*- """ Created on Thu Oct 23 20:29:33 2014 @author: dell """ from scipy import stats import matplotlib.pyplot as plt import numpy as np import random if __name__ == ‘__main__‘: ax1 = plt.subplot(211) x = [random.gauss(0, 1) for i in range(1000)] #res = stats.probplot(x, plot=plt) mylist = stats.cumfreq(x, numbins = 100) ax1.plot(mylist[0]) ax2 = plt.subplot(212) mylist1 = stats.cumfreq(x, numbins = 100, defaultreallimits = [0,1]) ax2.plot(mylist1[0]) plt.show()
defaultreallimits 还是不是很明白是什么定义, 没太看懂。
分位图:A quantile plot is just the plot of a CDF in which the x and y axes have been switched.
概率图:probability plot 高斯分布求反函数 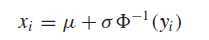 这样会落到同一条直线。
http://docs.scipy.org/doc/scipy-0.14.0/reference/generated/scipy.stats.probplot.html
# -*- coding: utf-8 -*-
"""
Created on Thu Oct 23 20:06:03 2014

@author: dell
"""

from scipy import stats
import matplotlib.pyplot as plt
import numpy as np
import random
if __name__ == ‘__main__‘:
    nsample = 100
    np.random.seed(7654321)

    #A t distribution with small degrees of freedom:
    ax = plt.subplot(321)
    x = stats.t.rvs(3, size=nsample)
    res = stats.probplot(x, plot=plt)

    #A t distribution with larger degrees of freedom:
    ax2 = plt.subplot(322)
    x = stats.t.rvs(25, size=nsample)
    res = stats.probplot(x, plot=plt)

    #A mixture of two normal distributions with broadcasting:
    ax3 = plt.subplot(323)
    x = stats.norm.rvs(loc=[0,5], scale=[1,1.5], size=(nsample/2.,2)).ravel()
    res = stats.probplot(x, plot=plt)

    #A standard normal distribution:
    ax4 = plt.subplot(324)
    x = stats.norm.rvs(loc=0, scale=1, size=nsample)
    res = stats.probplot(x, plot=plt)

    # my test
    ax5 = plt.subplot(325)
    x = [random.gauss(0, 1) for i in range(100)]
    res = stats.probplot(x, plot=plt)

    #my test
    ax6 = plt.subplot(326)
    x = np.random.rand(100) * 100
    res = stats.probplot(x, plot=plt)
    plt.show()
PIC2, The Cumulative Distribution Function and Quantile Plot
标签:style blog http color io ar for sp div
原文地址:http://www.cnblogs.com/hluo/p/4046436.html