标签:配置邮件告警 job receiver linux att gre ons 停止 ecs
二进制安装Prometheus服务器列表:
| 服务器名称 | 操作系统 | IP地址 | 服务 |
|---|---|---|---|
| test03 | Ubuntu 16.04.4 | 192.168.1.58 | Prometheus, Alertmanager,grafana |
| test02 | Ubuntu 16.04.4 | 192.168.1.57 | Node_exporter |
Prometheus官网下载地址:https://prometheus.io/download/
下载prometheus
root@test03:~# wget https://github.com/prometheus/prometheus/releases/download/v2.11.0/prometheus-2.11.0.linux-amd64.tar.gz解压prometheusroot@test03:~# tar xf prometheus-2.11.0.linux-amd64.tar.gz
移动到/usr/local/prometheus目录root@test03:~# mv prometheus-2.11.0.linux-amd64 /usr/local/prometheus
root@test03:~# cat  /lib/systemd/system/prometheus.service
[Unit]
Description=https://prometheus.io

[Service]
ExecStart=/usr/local/prometheus/prometheus --config.file="/usr/local/prometheus/prometheus.yml"

[Install]
WantedBy=multi-user.target
创建prometheus服务
root@test03:~# systemctl enable prometheus.service
Created symlink from /etc/systemd/system/multi-user.target.wants/prometheus.service to /lib/systemd/system/prometheus.service.启动prometheus服务root@test03:~# systemctl start prometheus.service
查看promethues服务状态
root@test03:~# systemctl status prometheus.service
● prometheus.service - https://prometheus.io
Loaded: loaded (/lib/systemd/system/prometheus.service; enabled; vendor preset: enabled)
Active: active (running) since Wed 2019-07-10 11:10:45 CST; 4s ago
Main PID: 818 (prometheus)
......
docker 安装
root@test03:~# docker run -d -p 3000:3000 grafana/grafana
root@test03:~# docker ps
CONTAINER ID        IMAGE               COMMAND             CREATED             STATUS              PORTS                    NAMES
a6ff7bd88b42 grafana/grafana "/run.sh" 43 seconds ago Up 41 seconds 0.0.0.0:3000->3000/tcp peaceful_brattain访问:http://192.168.1.58:3000
登录gafana界面:
默认账号是:admin
默认密码是:admin
第一次登录后,提示重新设置密码
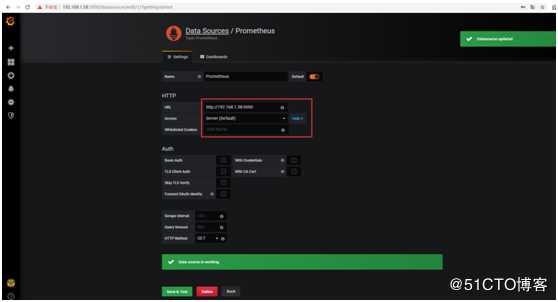
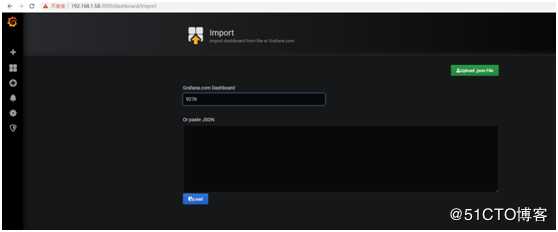
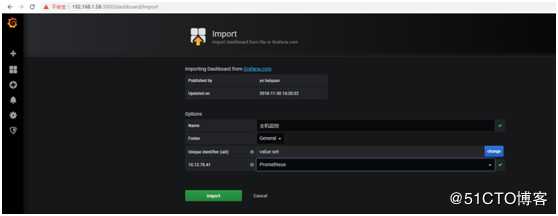
添加数据源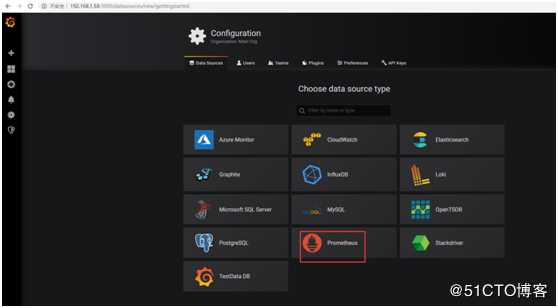
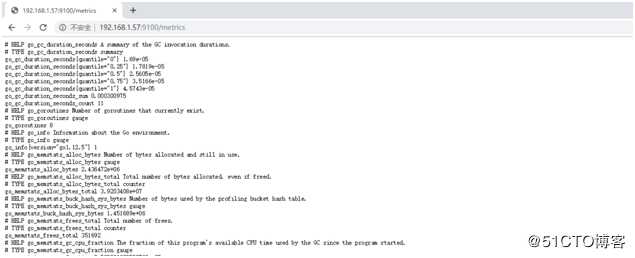
root@test02:~# wget https://github.com/prometheus/node_exporter/releases/download/v0.18.1/node_exporter-0.18.1.linux-amd64.tar.gz
root@test02:~# tar xf node_exporter-0.18.1.linux-amd64.tar.gz
root@test02:~# mv node_exporter-0.18.1.linux-amd64 /usr/local/node_exporter
root@test02:~# cd /usr/local/node_exporter
root@test02:/usr/local/node_exporter# cat /lib/systemd/system/node_exporter.service
[Unit]
Description=https://prometheus.io/docs/guides/node-exporter/

[Service]
ExecStart=/usr/local/node_exporter/node_exporter

[Install]
WantedBy=multi-user.target

root@test02:/usr/local/node_exporter# systemctl enable node_exporter.service
Created symlink from /etc/systemd/system/multi-user.target.wants/node_exporter.service to /lib/systemd/system/node_exporter.service.
root@test02:/usr/local/node_exporter# systemctl start node_exporter.service
root@test02:/usr/local/node_exporter# systemctl status node_exporter.service
● node_exporter.service - https://prometheus.io/docs/guides/node-exporter/
   Loaded: loaded (/lib/systemd/system/node_exporter.service; enabled; vendor preset: enabled)
   Active: active (running) since Wed 2019-07-10 14:23:35 CST; 5s ago
 Main PID: 774 (node_exporter)
   CGroup: /system.slice/node_exporter.service
└─774 /usr/local/node_exporter/node_exportercat /usr/local/prometheus/prometheus.yml
# my global config
global:
scrape_interval: 15s # Set the scrape interval to every 15 seconds. Default is every 1 minute.
evaluation_interval: 15s # Evaluate rules every 15 seconds. The default is every 1 minute.
# scrape_timeout is set to the global default (10s).
# Alertmanager configuration
alerting:
alertmanagers:
- static_configs:
- targets:
# - alertmanager:9093
# Load rules once and periodically evaluate them according to the global ‘evaluation_interval‘.
rule_files:
# - "first_rules.yml"
# - "second_rules.yml"
# A scrape configuration containing exactly one endpoint to scrape:
# Here it‘s Prometheus itself.
scrape_configs:
# The job name is added as a label `job=<job_name>` to any timeseries scraped from this config.
- job_name: ‘prometheus‘
# metrics_path defaults to ‘/metrics‘
# scheme defaults to ‘http‘.
static_configs:
- targets: [‘localhost:9090‘]
- job_name: ‘host‘
file_sd_configs:
- files: [‘/usr/local/prometheus/sd_config/host.yml‘]
refresh_interval: 5sroot@test03:/usr/local/prometheus/sd_config# cat /usr/local/prometheus/sd_config/host.yml
- targets:
- 192.168.1.57:9100重载配置文件
prometheus_id=`ps -ef |grep prometheus.yml|grep -v grep|awk ‘{print $2}‘`
kill -hup $prometheus_id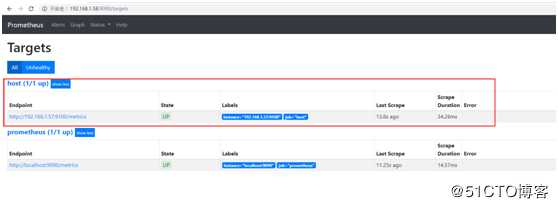
root@test03:~# wget https://github.com/prometheus/alertmanager/releases/download/v0.18.0/alertmanager-0.18.0.linux-amd64.tar.gz
root@test03:~# tar xf alertmanager-0.18.0.linux-amd64.tar.gz
root@test03:~# mv alertmanager-0.18.0.linux-amd64 /usr/local/alertmanagerroot@test03:~# cd /usr/local/alertmanager
root@test03:/usr/local/alertmanager# cat /lib/systemd/system/alertmanager.service
[Unit]
Description=https://prometheus.io/docs/prometheus/latest/configuration/alerting_rules/
[Service]
ExecStart=/usr/local/alertmanager/alertmanager --config.file=/usr/local/alertmanager/alertmanager.yml
[Install]
WantedBy=multi-user.targetroot@test03:/usr/local/alertmanager# cat /usr/local/alertmanager/alertmanager.yml
global:
resolve_timeout: 5m
smtp_smarthost: ‘smtp.163.com:25‘
smtp_from: ‘xxx@163.com‘
smtp_auth_username: ‘xxx@163.com‘
smtp_auth_password: ‘xxxxxx‘
smtp_require_tls: false
route:
group_by: [‘alertname‘]
group_wait: 10s
group_interval: 10s
repeat_interval: 1m
receiver: ‘mail‘
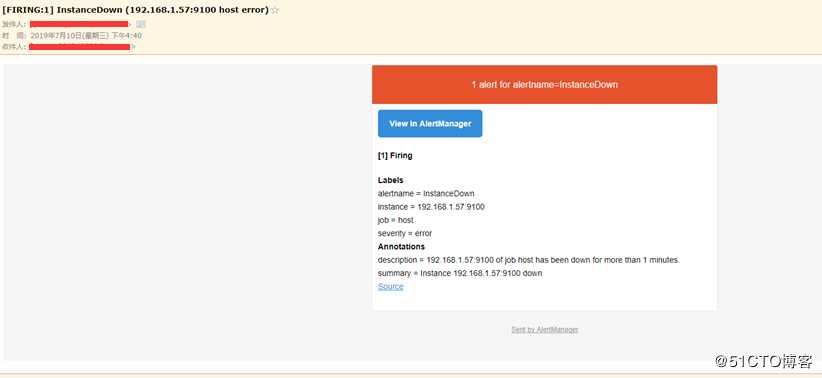
receivers:
- name: ‘mail‘
email_configs:
- to: ‘xxx@qq.com‘
root@test03:/usr/local/alertmanager# systemctl enable alertmanager.service
Created symlink from /etc/systemd/system/multi-user.target.wants/alertmanager.service to /lib/systemd/system/alertmanager.service.
root@test03:/usr/local/alertmanager# systemctl start alertmanager.service

root@test03:/usr/local/alertmanager# systemctl status alertmanager.service
● alertmanager.service - https://prometheus.io/docs/prometheus/latest/configuration/alerting_rules/
   Loaded: loaded (/lib/systemd/system/alertmanager.service; enabled; vendor preset: enabled)
   Active: active (running) since Wed 2019-07-10 16:28:20 CST; 2min 15s ago
 Main PID: 19847 (alertmanager)
    Tasks: 9
   Memory: 9.0M
      CPU: 290ms
   CGroup: /system.slice/alertmanager.service
           └─19847 /usr/local/alertmanager/alertmanager --config.file=/usr/local/alertmanager/alertmanager.yml
# Alertmanager configuration
alerting:
alertmanagers:
- static_configs:
- targets:
- 127.0.0.1:9093
# Load rules once and periodically evaluate them according to the global ‘evaluation_interval‘.
rule_files:
- "rules/*.yml"
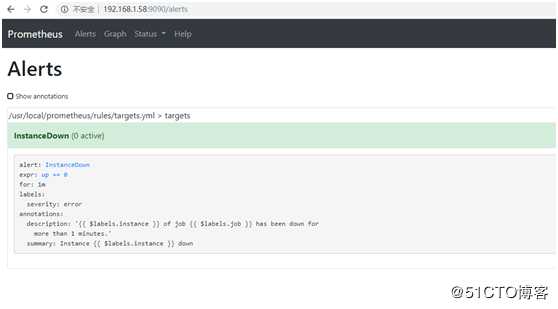
root@test03:/usr/local/prometheus/rules# cat /usr/local/prometheus/rules/targets.yml
groups:
- name: targets
rules:
# Alert for any instance that is unreachable for >5 minutes.
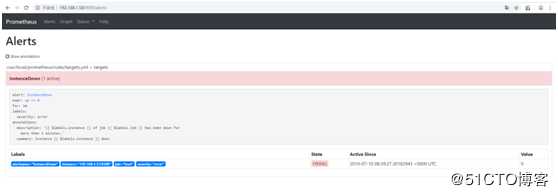
- alert: InstanceDown
expr: up == 0
for: 1m
labels:
severity: error
annotations:
summary: "Instance {{ $labels.instance }} down"
description: "{{ $labels.instance }} of job {{ $labels.job }} has been down for more than 1 minutes."prometheus_id=`ps -ef |grep prometheus.yml|grep -v grep|awk ‘{print $2}‘`
kill -hup $prometheus_id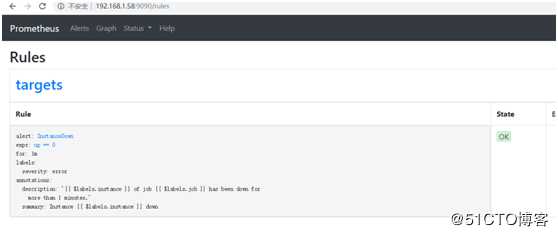
root@test02:~# systemctl stop node_exporter.service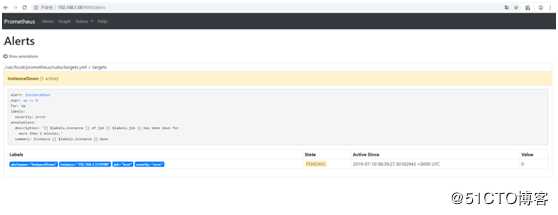
 *
* 
标签:配置邮件告警 job receiver linux att gre ons 停止 ecs
原文地址:https://blog.51cto.com/jiay1/2422888