标签:fir 字体样式 描述 dde cal 包含 fse 参考手册 alternate
SVG全称Scalable Vector Graphics,意为可缩放的矢量图,SVG使用XML格式定义图像。IE9及以上,Chrome,Opera,Safari,Firefor都兼容。
IE8和早期版本需要插件支持,如Adobe SVG浏览器。
SVG与Canvas的区别:
SVG:矢量图,不会失真,适合大面积的贴图,通常动画较少的或者简单的图标;SVG使用标签和CSS实现绘制。
Canvas:适合用于小面积的绘图,适合动画;Canvas使用标签和javascript实现绘制。
参考手册:https://www.runoob.com/svg/svg-reference.html
1 <style>
2     line{
3       stroke: black;
4       stroke-width: 5px;
5     }
6 </style>
7 <svg width="500" height="500" style="border:1px solid;">
8     <line x1="100" y1="100" x2="200" y2="100"></line>
9 </svg>
<style>
    rect{
      fill: transparent;//设置背景透明
      stroke: red;//设置边框为红色
    }
</style>
<svg width="500" height="500" style="border:1px solid;">
    <rect height="50" width="100" x="100" y="100" rx="5" ry="5"></rect>
</svg>
 1 <style>
 2     circle{
 3       fill: transparent;
 4       stroke: #f0f;
 5       stroke-width: 5px;
 6     }
 7 </style>
 8 <svg width="500" height="500" style="border:1px solid;">
 9     <circle r="50" cx="50" cy="220"></circle>
10 </svg>
 1 <style>
 2     ellipse{
 3       fill: transparent;
 4       stroke: blueviolet;
 5       stroke-width: 3px;
 6     }
 7 </style>
 8 <svg width="500" height="500" style="border:1px solid;">
 9 <ellipse rx="100" ry="30" cx="300" cy="200"></ellipse>
10 </svg>
 1 <style>
 2     polyline{
 3     fill:  none /* transparent */;
 4     stroke: blueviolet;
 5     stroke-width: 1px;
 6     }
 7 </style>
 8 <svg width="500" height="500" style="border:1px solid;">
 9     <polyline points="0 0,50 50,50 100,100 50"></polyline>
10 </svg>
注意polygon与polyline的绘制原理是一样的,唯一的区别就在于polygon绘制到最后一个点后会将结束点和起始点连接起来,形成多边形的图形。
 1 <style>
 2     polygon{
 3       fill:  none /* transparent */;
 4       stroke: blueviolet;
 5          stroke-width: 1px;
 6     }
 7 </style>
 8 <svg width="500" height="500" style="border:1px solid;">
 9 <polygon points="0 0,50 50,50 100,100 50"></polyline>
10 </svg>
 1 <style>
 2     text{
 3     font-size: 15px;/* 字体样式能作用text标签 */
 4     stroke: #faf; /* 设置文本颜色 */
 5     stroke-width: 3px; /* 设置字体粗细 */
 6     }
 7 </style>
 8 <svg width="500" height="500" style="border:1px solid;">
 9     <text x="300" y="50">台风韦帕再次登陆</text>
10 </svg>
用来设置SVG的图形的透明度和线条样式都是使用css样式来完成的,下面就来看看这些样式属性:
 1 //使用折线来测试这些样式
 2 polyline{
 3     /* fill:  none transparent; */
 4     stroke: blueviolet;
 5     stroke-width: 10px; /* 如果设置了线条透明,在线的中心上会出现一条可视的中心线 */
 6
 7     stroke-opacity: 0.5;/* 边框透明度 */
 8     fill-opacity: 0.3; /* 背景填充透明度 */
 9     stroke-linecap: square; /*round: 线的末端添加一个半圆;  square:线的末端添加一个线宽一致的方块 */
10     stroke-linejoin: round; /*设置折线的折角样式:round:圆角 \ bevel:切掉尖角 \ miter:默认*/
11 }
12 <svg width="500" height="500" style="border:1px solid;">
13     <polyline points="0 0,50 50,50 100,100 50"></polyline>
14 </svg>
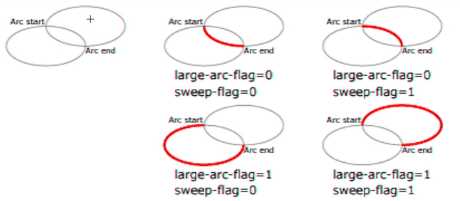
path标签用来绘制路径,默认情况下图形会有填充,元素使用d属性来描述路径绘制规则,d属性的参数内部包含指令和参数,详细了解d属性的内部指令:
 1 <style>
 2     path{
 3     fill: none;
 4     stroke: red;
 5     }
 6 </style>
 7 <svg width="500" height="500" style="border:1px solid;">
 8     <path d="M 100 100 L 200 100 L 200 200"></path><!--L绝对路径绘制-->
 9     <path d="M 100 100 l 100 0 l 200 200"></path><!--L相对路径绘制-->
10     <path d="M 100 100 H 200 V 200 200"></path><!--HV绝对路径绘制-->
11     <path d="M 100 100 h 200 v 200"></path><!--hv相对路径绘制-->
12 </svg>
1 path{
2     fill: none;
3     stroke: red;
4 }
5 <svg width="500" height="500" style="border:1px solid;">
6     <path d="M 100 100 A 100 50 30 1 0 100 180"></path>
7 </svg>
椭圆弧的原理图:

1 <svg width="500" height="500" style="border:1px solid;">
2     <defs>
3         <linearGradient id="bg1" x1="0" y1="0" x2="100%" x2="100%">
4             <stop offset="0%" style="stop-color: rgb(255,255,0)"></stop>
5             <stop offset="100%" style="stop-color: rgb(255,0,0)"></stop>
6         </linearGradient>
7     </defs>
8     <rect x="100" y="100" height="100" width="200" style="fill:url(#bg1)"></rect>
9 </svg>
SVG滤镜参考手册:https://www.runoob.com/svg/svg-filters-intro.html
基于之前的线性渐变的基础,叠加一个高斯模糊效果:
 1 <svg width="500" height="500" style="border:1px solid;">
 2     <defs>
 3         <linearGradient id="bg1" x1="0" y1="0" x2="100%" x2="100%">
 4             <stop offset="0%" style="stop-color: rgb(255,255,0)"></stop>
 5             <stop offset="100%" style="stop-color: rgb(255,0,0)"></stop>
 6         </linearGradient>
 7         <filter id="gaussian">
 8             <feGaussianBlur in="SourceGraphic" stdDeviation="10"></feGaussianBlur>
 9         </filter>
10     </defs>
11     <rect x="100" y="100" height="100" width="200" style="fill:url(#bg1);filter:url(#gaussian)"></rect>
12 </svg>
这里有一篇不错的相关博客:https://www.cnblogs.com/zmxmumu/p/6069846.html
有了上面两个样式,加上CSS动画控制stroke-dashoffset的偏移量,就可以实现直线伸缩动画:
 1 <style>
 2     .line1{
 3         stroke: black;
 4         stroke-width: 10px;
 5
 6         stroke-dasharray: 200px;/*创建虚线*/
 7         stroke-dashoffset: 200px; /*定义虚线描边的偏移量(在路径开始的前面,看不到)*/
 8         animation: move 2s linear infinite alternate-reverse;
 9     }
10     @keyframes move{
11         0%{
12             stroke-dashoffset: 200px;
13         }
14         100%{
15             stroke-dashoffset: 0px;
16         }
17     }
18 </style>
19 <svg width="500" height="500" style="border:1px solid;">
20     <line x1="100" y1="100" x2="300" y2="100" class="line1"></line>
21 </svg>
viewBox最常见的应用场景就是web端的地图,在标题中使用了比例尺的描述也就是通常以同比例的方式修改width,height就可以实现地图的放大与缩小;修改x,y的坐标就可以实现地图的窗口移动。
<svg width="500" height="500" style="border:1px solid;" viewBox="0,0,250,250">
标签:fir 字体样式 描述 dde cal 包含 fse 参考手册 alternate
原文地址:https://www.cnblogs.com/ZheOneAndOnly/p/11293920.html