标签:white 作用 src with pad cloud his log 指示器
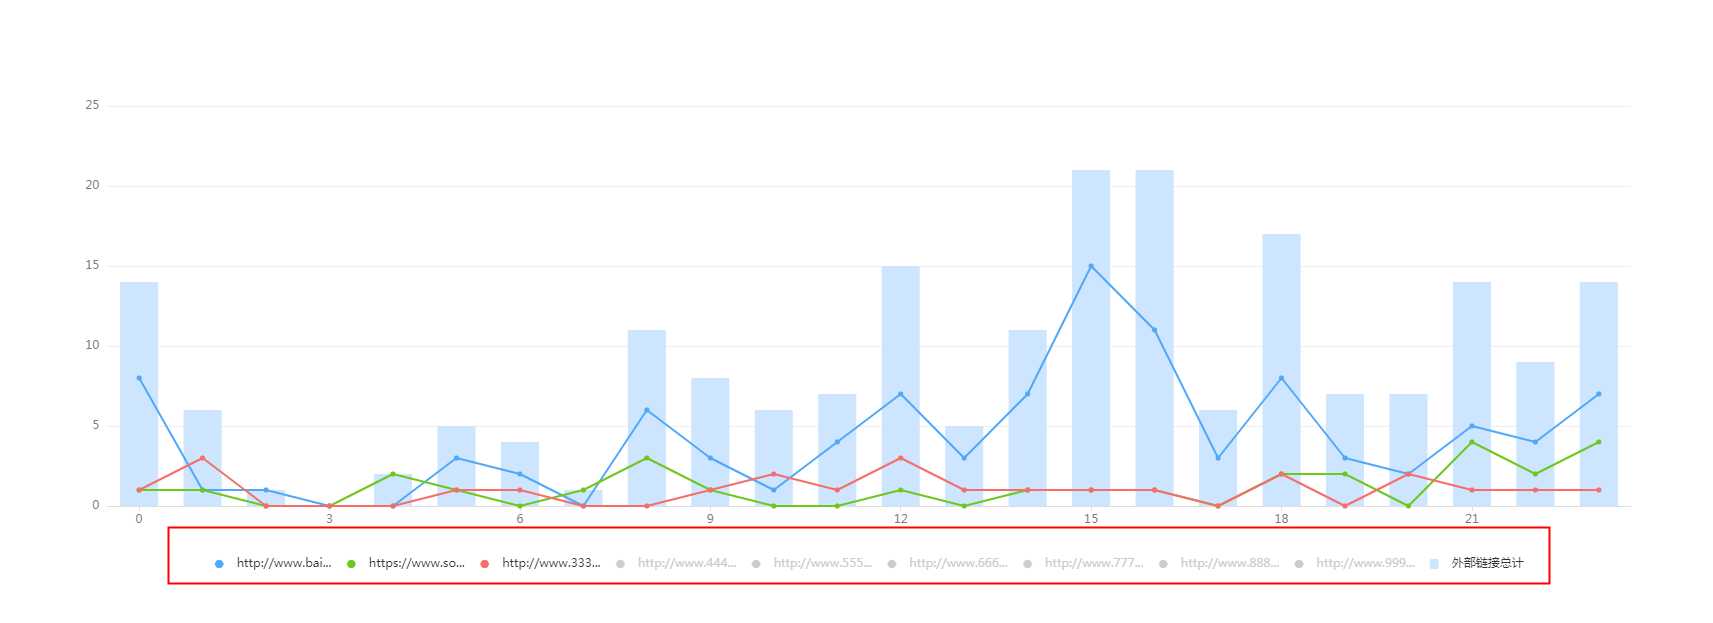
类似百度统计,有的时候legend的个数比较多,但是前端需要控制初始化显示的个数,以及最多显示的条数,先看效果图:

先给代码:
<!DOCTYPE html>
<html lang="en">

<head>
    <meta charset="UTF-8">
    <meta name="viewport" content="width=device-width, initial-scale=1.0">
    <meta http-equiv="X-UA-Compatible" content="ie=edge">
    <title>Document</title>
    <script src="https://apps.bdimg.com/libs/jquery/2.1.4/jquery.min.js"></script>
    <script src="https://cdnjs.cloudflare.com/ajax/libs/echarts/4.2.1/echarts-en.min.js"></script>
</head>

<body>
    <div id="all_line" style="width:100%;height:500px;margin-top: 100px;"></div>

    <script>
        var obj = {};
        var text_data = [‘http://www.baidu.com‘, ‘https://www.sogou.com‘, ‘http://www.333.com‘,
            ‘http://www.444.com‘, ‘http://www.555.com‘, ‘http://www.666.com‘, ‘http://www.777.com‘,
            ‘http://www.888.com‘, ‘http://www.999.com‘, ‘外部链接总计‘
        ];
        for (var i = 0; i < text_data.length; i++) {
            if (i > 2 && (i < text_data.length - 1)) {
                obj[text_data[i]] = false;
            } else {
                obj[text_data[i]] = true;
            }
            obj[text_data[text_data.length - 1]] = true;
        }
        // console.log(obj)
        var myChart = echarts.init(document.getElementById(‘all_line‘));
        myChart ? myChart.clear() : "";
        myChart.setOption({
            tooltip: {
                trigger: ‘axis‘,
                backgroundColor: ‘rgba(255,255,255,0.8)‘,
                axisPointer: { // 坐标轴指示器,坐标轴触发有效
                    type: ‘shadow‘, // 默认为直线,可选为:‘line‘ | ‘shadow‘
                    shadowStyle: {
                        color: ‘rgba(150,150,150,0.2)‘
                    }
                },
                textStyle: {
                    color: ‘#666‘,
                    fontSize: ‘14px‘,
                },
                extraCssText: ‘width:220px;height:60%;padding:0;box-shadow: 0 0 3px rgba(0, 0, 0, 0.3);"‘,
                formatter: function (params) {
                    var htmlStr = "";
                    for (var i = 0; i < params.length; i++) {
                        var tem = params[i].name;
                        var val = params[i].value;
                        if (tem.indexOf(‘/‘) < 0) {
                            tem > 9 ? tem = tem + ":00 - " + tem + ":59" : tem = "0" + tem + ":00 - " +
                                "0" + tem + ":59";
                        }
                        val > 0 ? val = val : val = ‘--‘
                        htmlStr +=
                            ‘<div style="height:26px;line-height:26px;overflow:hidden;padding:6px 8px;">‘ +
                            ‘<span style="float:left;max-width:160px;overflow:hidden;text-overflow: ellipsis;white-space: nowrap;">‘ +
                            ‘<span style="margin-right:5px;display:inline-block;width:10px;height:10px;border-radius:5px;background-color:‘ +
                            params[i].color + ‘;"></span>‘ + params[i].seriesName + ‘</span>‘ +
                            ‘<span style="float:right">‘ + val + ‘</span>‘ + ‘</div>‘
                    }
                    var res =
                        ‘<div><div style="height:40px;line-height:40px;padding:0 8px;background:rgba(237,233,233,0.4)">‘ +
                        tem + ‘<span style="float:right;">‘ + $(‘.table-echarts ul.group li.cur‘).text() +
                        ‘</span>‘ + htmlStr + ‘</div></div>‘
                    return res;
                },
            },
            textStyle: {
                color: ‘rgb(120, 122, 125)‘,
            },
            color: [‘#4fa8f9‘, ‘#6ec71e‘, ‘#f56e6a‘, ‘#fc8b40‘, ‘#818af8‘, ‘#31c9d7‘, ‘#f35e7a‘, ‘#ab7aee‘,
                ‘#14d68b‘, ‘#cde5ff‘
            ],
            grid: {
                top: 30, //越大越靠下,默认60
                bottom: 70
            },
            legend: {
                bottom: 1,
                itemGap: 15,
                itemWidth: 9,
                itemHeight: 10,
                textStyle: {
                    padding: [0, 0, 0, 8],
                },
                formatter: function (name) {
                    return (name.length > 14 ? (name.slice(0, 14) + "...") : name);
                },
                selected: obj,
                data: text_data
            },
            xAxis: [{
                type: ‘category‘,
                // boundaryGap: false,//坐标轴两边留白策略
                axisTick: {
                    alignWithLabel: true
                },
                axisLabel: {
                    interval: 2
                },
                axisLine: {
                    lineStyle: {
                        color: "#ddd"
                    }
                },
                data: [‘0‘, ‘1‘, ‘2‘, ‘3‘, ‘4‘, ‘5‘, ‘6‘, ‘7‘, ‘8‘, ‘9‘, ‘10‘, ‘11‘, ‘12‘, ‘13‘, ‘14‘,
                    ‘15‘, ‘16‘, ‘17‘, ‘18‘, ‘19‘, ‘20‘, ‘21‘, ‘22‘, ‘23‘
                ],
            }],
            yAxis: [{
                type: ‘value‘,
                axisLine: {
                    lineStyle: {
                        color: "transparent"
                    }
                },
                splitLine: {
                    lineStyle: {
                        color: ‘#eee‘,
                    }
                }
            }],
            series: [{
                    name: ‘http://www.baidu.com‘,
                    type: ‘line‘,
                    symbol: ‘circle‘,
                    symbolSize: ‘5‘,
                    data: [8, 1, 1, 0, 0, 3, 2, 0, 6, 3, 1, 4, 7, 3, 7, 15, 11, 3, 8, 3, 2, 5, 4, 7]
                },
                {
                    name: ‘https://www.sogou.com‘,
                    type: ‘line‘,
                    symbol: ‘circle‘,
                    symbolSize: ‘5‘,
                    data: [1, 1, 0, 0, 2, 1, 0, 1, 3, 1, 0, 0, 1, 0, 1, 1, 1, 0, 2, 2, 0, 4, 2, 4]
                },
                {
                    name: ‘http://www.333.com‘,
                    type: ‘line‘,
                    symbol: ‘circle‘,
                    symbolSize: ‘5‘,
                    data: [1, 3, 0, 0, 0, 1, 1, 0, 0, 1, 2, 1, 3, 1, 1, 1, 1, 0, 2, 0, 2, 1, 1, 1]
                },
                {
                    name: ‘http://www.444.com‘,
                    type: ‘line‘,
                    symbol: ‘circle‘,
                    symbolSize: ‘5‘,
                    data: [0, 0, 0, 0, 0, 0, 0, 0, 1, 0, 1, 2, 3, 0, 0, 0, 3, 1, 0, 2, 0, 1, 0, 0]
                },
                {
                    name: ‘http://www.555.com‘,
                    type: ‘line‘,
                    symbol: ‘circle‘,
                    symbolSize: ‘5‘,
                    data: [0, 0, 0, 0, 0, 0, 1, 0, 1, 1, 0, 0, 1, 1, 0, 1, 0, 1, 2, 0, 1, 1, 2, 0]
                },
                {
                    name: ‘http://www.666.com‘,
                    type: ‘line‘,
                    symbol: ‘circle‘,
                    symbolSize: ‘5‘,
                    data: [0, 1, 0, 0, 0, 0, 0, 0, 0, 1, 0, 0, 0, 0, 0, 0, 2, 0, 2, 0, 0, 1, 0, 0]
                },
                {
                    name: ‘http://www.777.com‘,
                    type: ‘line‘,
                    symbol: ‘circle‘,
                    symbolSize: ‘5‘,
                    data: [2, 0, 0, 0, 0, 0, 0, 0, 0, 0, 1, 0, 0, 0, 1, 1, 0, 1, 0, 0, 0, 0, 0, 1]
                },
                {
                    name: ‘http://www.888.com‘,
                    type: ‘line‘,
                    symbol: ‘circle‘,
                    symbolSize: ‘5‘,
                    data: [0, 0, 0, 0, 0, 0, 0, 0, 0, 0, 0, 0, 0, 0, 1, 1, 1, 0, 0, 0, 0, 0, 0, 0]
                },
                {
                    name: ‘http://www.999.com‘,
                    type: ‘line‘,
                    symbol: ‘circle‘,
                    symbolSize: ‘5‘,
                    data: [0, 0, 0, 0, 0, 0, 0, 0, 0, 1, 1, 0, 0, 0, 0, 1, 0, 0, 0, 0, 0, 0, 0, 0]
                },
                {
                    name: ‘外部链接总计‘,
                    type: ‘bar‘,
                    barWidth: ‘60%‘,
                    data: [14, 6, 1, 0, 2, 5, 4, 1, 11, 8, 6, 7, 15, 5, 11, 21, 21, 6, 17, 7, 7, 14, 9, 14]
                }
            ]
        })
        //echarts点击事件
        var oop = text_data.slice(0, 4);
        myChart.on(‘legendselectchanged‘, function (params) {
            // console.log(params);
            if (text_data.length > 4) {
                var legend_option = this.getOption();
                var selectArr = Object.values(params.selected)
                var num = 0;
                for (var i = 0; i < selectArr.length; i++) {
                    selectArr[i] === true ? num++ : "";
                }
                if (num > 4) {
                    oop.push(params.name);
                }
                if (num > 6) {
                    var hah = oop.slice(oop.length - 7, oop.length - 6)[0] + ‘‘;
                    legend_option.legend[0].selected[hah] = false;
                }

            }
            this.setOption(legend_option)
        });
        window.onresize = function () {
            myChart ? myChart.resize() : "";
        };
    </script>
</body>

</html>
直接copy就能看到效果。上面是限制了初始化显示legend的前三个和最后一个,用户点击最多显示6个。当然 你可以修改参数自己定义个数。
Tips:
由于少于150个字不能发到博客园首页,所以我再多说几句:
在用数据刷新echarts图表时,最好先用clear()函数去清空(echarts自带的api),还有就是其实echarts完全可以由数据渲染,比如说上面的例子,它的颜色可以事先定义一个数组,把可能用到的颜色放入这个数组,然后通过你legend的个数从数组去length相同的值组成新数组,然后以变量的形式去配置。上面例子用自定义的formatter去修改了tooltip的颜色以及legend的样式。
标签:white 作用 src with pad cloud his log 指示器
原文地址:https://www.cnblogs.com/wiliam/p/11351518.html