标签:color nan nes gen 定义 div otl UNC grid
矢量化指的是用数组代替标量来操作数组里的每个元素。
numpy提供了vectorize函数,可以把处理标量的函数矢量化,返回的函数可以直接处理ndarray数组。
#函数矢量化
import math as m
import numpy as np

def foo(x, y):
  return m.sqrt(x ** 2 + y ** 2)

x, y = 3, 4
print(foo(x, y))  # 5.0
x, y = np.array([3, 4, 5, 6]), np.array([4, 5, 6, 7])
# foo 函数矢量化 返回矢量化函数
foo_vec = np.vectorize(foo)
print(foo_vec(x, y))
# [5.         6.40312424 7.81024968 9.21954446]

print(np.vectorize(foo)(x, y))
# [5.         6.40312424 7.81024968 9.21954446]
numpy还提供了frompyfunc函数,也可以完成与vectorize相同的功能
# 把foo转换成矢量函数,该矢量函数接收2个参数,返回一个结果
fun = np.frompyfunc(foo, 2, 1)
d = fun(x, y)
print(d)
# [5.0 6.4031242374328485 7.810249675906654 9.219544457292887]
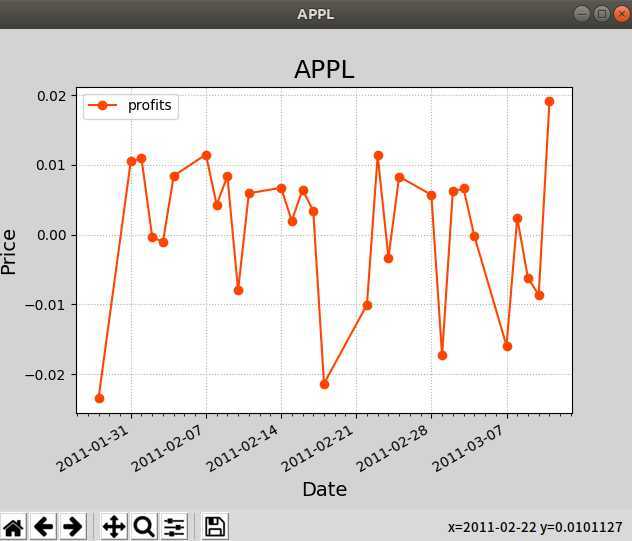
案例:定义一种买进卖出策略,通过历史数据判断这种策略是否值得实施。
# 矢量化
import numpy as np
import matplotlib.pyplot as mp
import datetime as dt
import matplotlib.dates as md


def dmy2ymd(dmy):
  """
  把日月年转年月日
  :param day:
  :return:
  """
  dmy = str(dmy, encoding=‘utf-8‘)
  t = dt.datetime.strptime(dmy, ‘%d-%m-%Y‘)
  s = t.date().strftime(‘%Y-%m-%d‘)
  return s


dates, opening_prices, highest_prices, lowest_prices, closing_prices =   np.loadtxt(‘aapl.csv‘,
             delimiter=‘,‘,
             usecols=(1, 3, 4, 5, 6),
             unpack=True,
             dtype=‘M8[D],f8,f8,f8,f8‘,
             converters={1: dmy2ymd})  # 日月年转年月日
# print(dates)
# 绘制收盘价的折现图
mp.figure(‘APPL‘, facecolor=‘lightgray‘)
mp.title(‘APPL‘, fontsize=18)
mp.xlabel(‘Date‘, fontsize=14)
mp.ylabel(‘Price‘, fontsize=14)
mp.grid(linestyle=":")

# 设置刻度定位器
# 每周一一个主刻度,一天一个次刻度

ax = mp.gca()
ma_loc = md.WeekdayLocator(byweekday=md.MO)
ax.xaxis.set_major_locator(ma_loc)
ax.xaxis.set_major_formatter(md.DateFormatter(‘%Y-%m-%d‘))
ax.xaxis.set_minor_locator(md.DayLocator())
# 修改dates的dtype为md.datetime.datetiem
dates = dates.astype(md.datetime.datetime)


# 定义买入卖出策略,计算每天的收益率
def profit(opening_price, highest_price,
           lowset_priec, closing_price):
  buying_price = opening_price * 1
  if (highest_price > buying_price > lowset_priec):
    return (closing_price - buying_price) / buying_price
  return np.nan
#计算每天的收益率:
profits = np.vectorize(profit)(opening_prices,highest_prices,lowest_prices,closing_prices)
print(profits)
isnan_mask = np.isnan(profits)
#取反
dates,profits = dates[~isnan_mask],profits[~isnan_mask]
mp.plot(dates,profits,‘o-‘,color=‘orangered‘,label=‘profits‘)

print(profits.mean())#-0.0015498765393923365


mp.legend()
mp.gcf().autofmt_xdate()
mp.show()

标签:color nan nes gen 定义 div otl UNC grid
原文地址:https://www.cnblogs.com/maplethefox/p/11473799.html