标签:serve layer rest amp 地图服务 源代码下载 官网 移动 topic
openlayers4 官网的 api 文档介绍地址 openlayers4 api,里面详细的介绍 openlayers4 各个类的介绍,还有就是在线例子:openlayers4 官网在线例子,这个也是学习 openlayers4 的好素材。
openlayers4 入门开发系列的地图服务基于 Geoserver 发布的,关于 Geoserver 方面操作的博客,可以参考以下几篇文章:
1.基于 openlayers4 结合 echarts4 交通线流动图
2.源代码 demo 下载
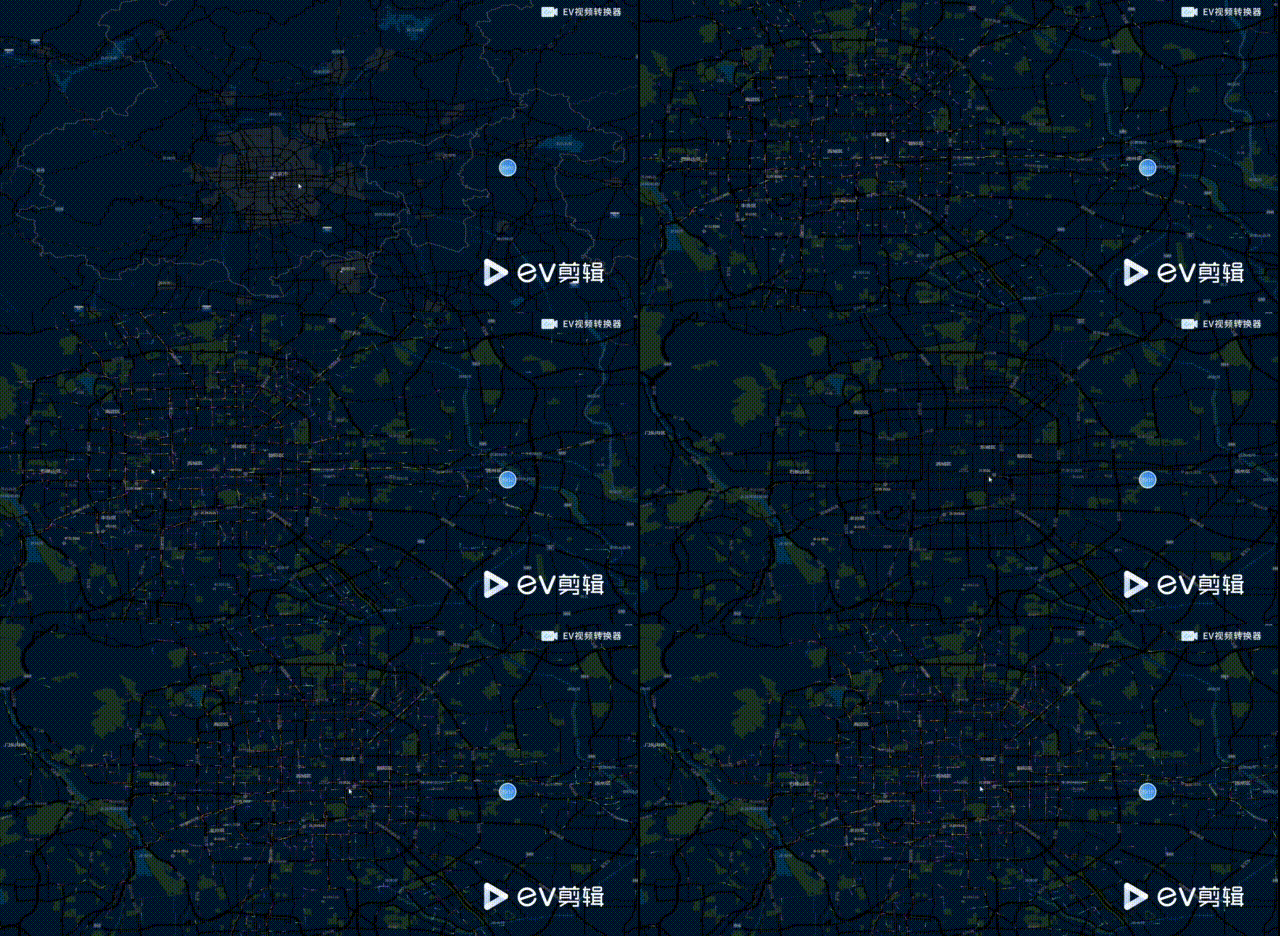
效果图如下:
/**
* 地图创建初始化
*/
var map = new ol.Map({
target: ‘map‘,
layers: [
new ol.layer.Tile({
source: new ol.source.XYZ({
url: ‘http://cache1.arcgisonline.cn/arcgis/rest/services/ChinaOnline‘ +
‘StreetPurplishBlue/MapServer/tile/{z}/{y}/{x}‘
})
})
],
view: new ol.View({
center: [116.55406673632812, 39.94828066015626],
projection: ‘EPSG:4326‘,
zoom: 10
})
});
var hStep = 300 / (rawData.length - 1);
var busLines = [].concat.apply([], rawData.map(function (busLine, idx) {
var prevPt;
var points = [];
for (var i = 0; i < busLine.length; i += 2) {
var pt = [busLine[i], busLine[i + 1]];
if (i > 0) {
pt = [
prevPt[0] + pt[0],
prevPt[1] + pt[1]
];
}
prevPt = pt;

points.push([pt[0] / 1e4, pt[1] / 1e4]);
}
return {
‘coords‘: points,
‘lineStyle‘: {
‘normal‘: {
‘color‘: echarts.color.modifyHSL(‘#5A94DF‘, Math.round(hStep * idx))
}
}
};
}));

var option = {
‘series‘: [
{
‘type‘: ‘lines‘,
‘polyline‘: true,
‘data‘: busLines,
‘lineStyle‘: {
‘normal‘: {
‘width‘: 0
}
},
‘effect‘: {
‘constantSpeed‘: 20,
‘show‘: true,
‘trailLength‘: 0.5,
‘symbolSize‘: 1.5
},
‘zlevel‘: 1
}
]
};
var echartslayer = new ol3Echarts(option, {
stopEvent: false,
hideOnMoving: false,
hideOnZooming: false,
forcedPrecomposeRerender: true,
});
echartslayer.appendTo(map)
html 页面引用:
完整demo源码见小专栏文章尾部:GIS之家leaflet小专栏
文章尾部提供源代码下载,对本专栏感兴趣的话,可以关注一波
openlayers4 入门开发系列结合 echarts4 实现交通线流动图
标签:serve layer rest amp 地图服务 源代码下载 官网 移动 topic
原文地址:https://www.cnblogs.com/giserhome/p/11488540.html