标签:name xls das 图片 ack black tla position class
input: gap1Ur8.xlsx
t	dis	cl 	cd
0.005	0	-0.05781	0
0.01	-3.00E-06	-0.03478	0.37145
0.015	-9.00E-06	-0.04407	0.28399
0.02	-2.00E-05	-0.03909	0.25275
0.025	-3.40E-05	-0.04029	0.24478
0.03	-5.20E-05	-0.03861	0.25036
0.035	-7.30E-05	-0.03803	0.26657
0.04	-9.70E-05	-0.0367	0.29228
output:
code:
%%%%%%%%%%
% author: guiofei HIT
%%%%%%%%%%%
clear;
clc;
%% read xls data
data=xlsread(‘gap1Ur8.xlsx‘);
A1=data(1000:10000,1); % 1st column; rows(1e3, 1e4)
A2=data(1000:10000,2);
A3=data(1000:10000,3);
A4=data(1000:10000,4);
%%%%%%%%%%%%%%%%%%%%%%%%%%%%%%%%%%%%%%%%%%%%%%%%
%% 1st figure
%%%%%%%%%%%%%%%%%%%%%%%%%%%%%%%%%%%%%%%%%%%%%%%%
figure(1);
U=1.1686;
%%
fig_hei=0.28; % height
fig_wei=0.9; % width
lef_cor_x=0.08;
lef_cor_y=0.1;
%% plot data
%cd, drag coeffcient
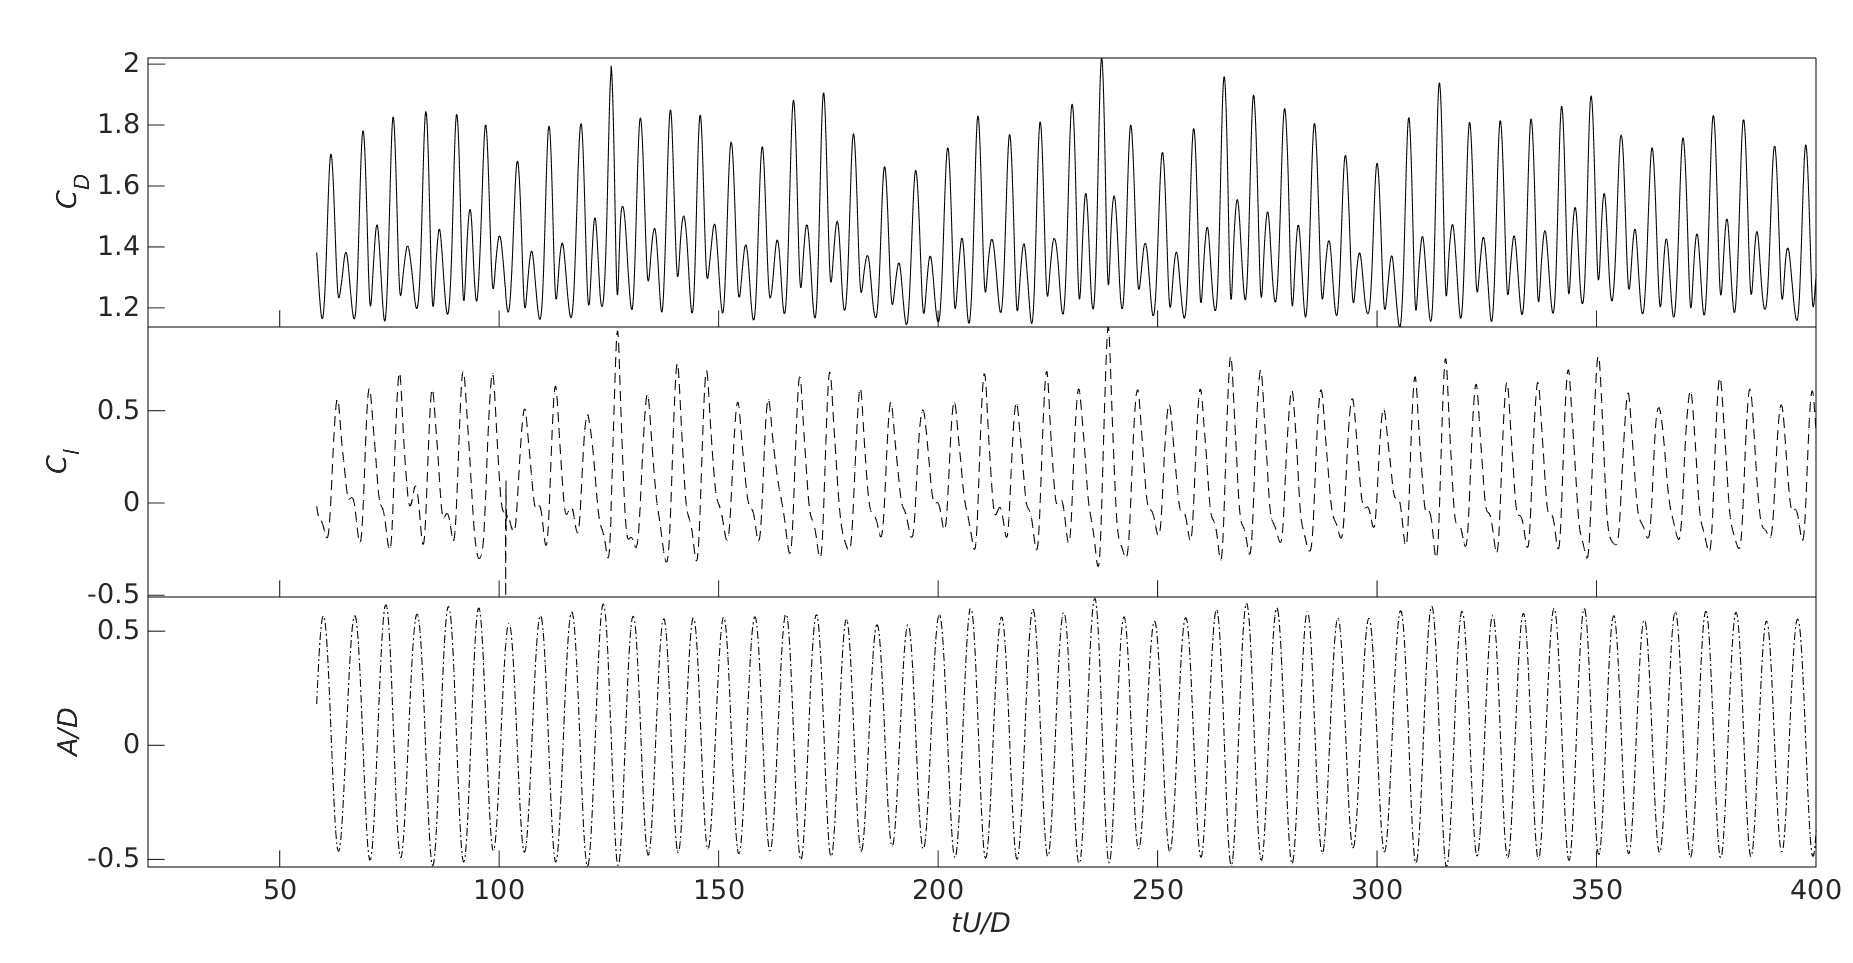
subplot(3,1,1,‘position‘, [lef_cor_x lef_cor_y+fig_hei+fig_hei fig_wei fig_hei])
% 3 rows, 1 column, 1st subfigure [left bottom width height]
plot(A1*U/0.1,A4,‘k-‘); % black color, solid line
ylabel(‘\itC_{D}‘,‘fontsize‘,20,‘fontname‘,‘Times New Roman‘);
set(gca,‘fontsize‘,20,‘fontname‘,‘Times New Roman‘)
axis([20,400,-inf,inf])
set(gca,‘xticklabel‘,[])
box off
ax2 = axes(‘Position‘,get(gca,‘Position‘),...
‘XAxisLocation‘,‘top‘,...
‘YAxisLocation‘,‘right‘,...
‘Color‘,‘none‘,...
‘XColor‘,‘k‘,‘YColor‘,‘k‘);
set(ax2,‘YTick‘, []);
set(ax2,‘XTick‘, []);
box on
% cl, lift coefficient
subplot(3,1,2,‘position‘, [lef_cor_x lef_cor_y+fig_hei fig_wei fig_hei]) % 2nd subfigure
plot(A1*U/0.1,A3,‘k --‘); % dashed line
ylabel(‘\itC_{l}‘,‘fontsize‘,20,‘fontname‘,‘Times New Roman‘);
set(gca,‘fontsize‘,20,‘fontname‘,‘Times New Roman‘)
axis([20,400,-inf,inf])
set(gca,‘xticklabel‘,[])
box off
ax2 = axes(‘Position‘,get(gca,‘Position‘),...
‘XAxisLocation‘,‘top‘,...
‘YAxisLocation‘,‘right‘,...
‘Color‘,‘none‘,...
‘XColor‘,‘k‘,‘YColor‘,‘k‘);
set(ax2,‘YTick‘, []);
set(ax2,‘XTick‘, []);
box on
%A/D
subplot(3,1,3,‘position‘, [lef_cor_x lef_cor_y fig_wei fig_hei]) % 3rd subfigure
plot(A1*U/0.1,A2/0.1,‘k -.‘); % dashdot line
ylabel(‘\itA/D‘,‘fontsize‘,20,‘fontname‘,‘Times New Roman‘);
xlabel(‘\ittU/D‘,‘fontsize‘,20,‘fontname‘,‘Times New Roman‘);
set(gca,‘fontsize‘,20,‘fontname‘,‘Times New Roman‘)
axis([20,400,-inf,inf])
box off
ax2 = axes(‘Position‘,get(gca,‘Position‘),...
‘XAxisLocation‘,‘top‘,...
‘YAxisLocation‘,‘right‘,...
‘Color‘,‘none‘,...
‘XColor‘,‘k‘,‘YColor‘,‘k‘);
set(ax2,‘YTick‘, []);
set(ax2,‘XTick‘, []);
box on
标签:name xls das 图片 ack black tla position class
原文地址:https://www.cnblogs.com/code-saturne/p/11559447.html