标签:参考 eol png inf atp 似然函数 for com min
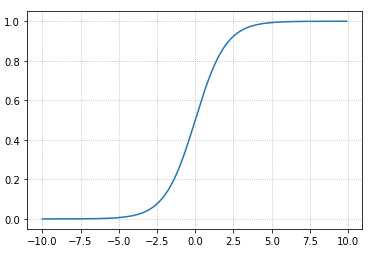
? Logistic回归在本质上是线性回归,只是在特征到结果的映射中加入了一层函数映射,即先把特征线性求和,然后使用函数\(g(z)\)将上述结果映射到0-1上。
优点:计算代价不高,易于理解和实现
缺点:容易欠拟合,分类精度不高
适用数据:数值型和标称型
\[ g(z)=\frac{1}{1+e^{-z}} \]
\[ z = \theta_0+\theta_1x_1+\theta_2x_2+...+\theta_nx_n \]
\[ g^{'}(z)=g(z)(1-g(z)) \]

如下代码:
import numpy as np
import matplotlib.pyplot as plt
x = np.arange(-10,10,0.1)
y = 1./(1.+np.exp(-x))
plt.grid(b=True, ls=':')
plt.plot(x, y)
首先假设:
\[
P(y=1|x;θ)=h_θ(x)
\]
\[ P(y=0|x;θ)=1-h_θ(x) \]
\[ P(y|x;θ)=(h_θ(x))^y(1-h_θ(x))^{1-y} \]
根据似然函数如下:
\[
L(θ)=P(Y|X;θ)=\prod_{i=1}^{m}{p(y^i|x^i;θ)}
\]
取对数,为对数似然函数:
\[
l(θ)=\log L(θ)=\sum_{i=1}^{m}{y^ilog(h_\theta(x^i))+(1-y^i)log(1-h_\theta(x^i))}
\]
注:\(h_θ(x^i)=g(θ^Tx^i)\)
由上述的对数似然函数出以下结论:在取某θ时,数似然函数取最大值,表面此时的参数为最优;
由此将似然函数取反,定义完整的损失函数如下:
\[ loss(h_\theta(x),y)=-\sum_{i=1}^{m}{y^ilog(h_\theta(x^i))+(1-y^i)log(1-h_\theta(x^i))} \]
\[ J(\theta)=\frac{1}{m}\sum_{i=1}^{m}{loss(h_\theta(x^{(i)},y^{(i)}))} \]
\[ minJ(\theta) \]
? 通过梯度下降对J(θ)进行求解,结果如下:
\[
\frac{?J(\theta)}{?\theta_j}=\frac{1}{m}\sum_{i=1}^{m}{(g(θ^Tx^i)-y^i)x_j^i}
\]
? 更新参数
\[
\theta_j=\theta_j - \alpha\frac{?J(\theta)}{?\theta_j}
\]
同线性回归中梯度下降的正则化
sklearn.linear_model.LogisticRegression(penalty=‘l2’, C = 1.0)

# Logistic回归分类器
# coef_:回归系数
# 注:默认使用了l2正则化
案例——肿瘤良性、恶性预测
# 导入必要的库
import numpy as np
import pandas as pd
from sklearn.model_selection import train_test_split
from sklearn.linear_model import LogisticRegression
from sklearn.preprocessing import StandardScaler

# 读取数据
# 构造列标签名字
column = ['Sample code number','Clump Thickness', 'Uniformity of Cell Size','Uniformity of Cell Shape','Marginal Adhesion', 'Single Epithelial Cell Size','Bare Nuclei','Bland Chromatin','Normal Nucleoli','Mitoses','Class']

# 读数据
data = pd.read_csv("./breast-cancer-wisconsin.data", names=column)
# print(data)

# 对缺失值进行处理
data = data.replace(to_replace="?", value=np.nan)

# 丢弃缺失值
data = data.dropna()

# 对数据进行分割
x_train, x_test, y_train, y_test = train_test_split(data[column[1:10]], data[column[10]], test_size=0.25)

# 进行标准化处理
std = StandardScaler()

x_train = std.fit_transform(x_train)
x_test = std.transform(x_test)

# 逻辑回归预测
lg = LogisticRegression(C=1.0)

lg.fit(x_train, y_train)
print(lg.coef_)
# [[1.18661055 0.37775507 0.77048383 0.72337353 0.40801567 1.31255209  0.72011434 0.52286549 0.69823535]]

# 模型评估
y_predict = lg.predict(x_test)

# 准确率
print("准确率为:", lg.score(x_test, y_test))
# 准确率为: 0.9649122807017544

from sklearn.metrics import classification_report
# 召回率
print("召回率为:", classification_report(y_test, y_predict, labels=[2, 4], target_names=["良性", "恶性"]))
# 召回率为:          precision  recall    f1-score    support
#
#          良性       0.97      0.97      0.97       116
#          恶性       0.95      0.95      0.95        55
#
# avg / total 0.96 0.96 0.96 171https://github.com/zhuChengChao/ML-LogisticsRegression
标签:参考 eol png inf atp 似然函数 for com min
原文地址:https://www.cnblogs.com/zhuchengchao/p/11629717.html