标签:span pyplot img 例子 lin 宽度 效果 inf ops
有时我们在进行可视化的时候需要用箭头来指出某个点表示的特别的含义。这里给出一个例子来记录一下。
 1 import numpy as np
 2 import matplotlib.pyplot as plt
 3
 4 x = np.linspace(-3,3,100)
 5 y = x**2
 6
 7 x_l = [-3,-2]
 8 y_l = [9,4]
 9 position_text = {‘qwe‘:(-3,-9),‘rty‘:(-2,4)}   # 定义的是箭头初始的位置和箭头需要指示的内容
10
11 plt.axis([-3,3,0,10])
12
13 for name,pos_text in position_text.items():
14     plt.annotate(name,xy=(1,1),xytext=pos_text,arrowprops=dict(facecolor=‘black‘,width=0.5,shrink=0.1,headwidth=5))
15 plt.plot(x,y,‘r‘)
16 plt.show()
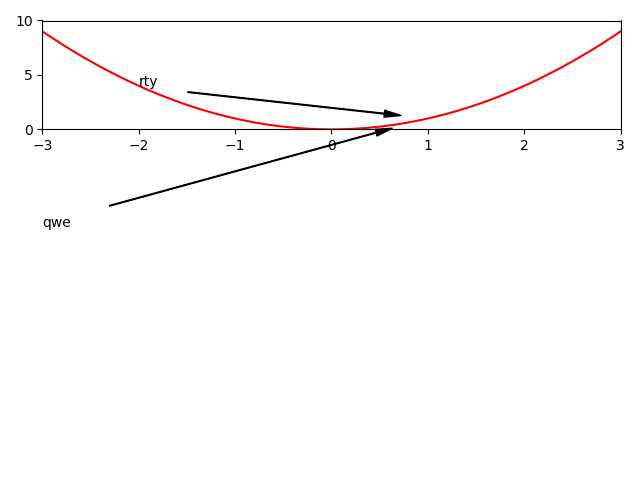
得到的效果图是

其中主要起作用的函数是
plt.annotate(name,xy=(1,1),xytext=pos_text,arrowprops=dict(facecolor=‘black‘,width=0.5,shrink=0.1,headwidth=5))
其中参数表示的意义分别是
# name:注释的内容
#xy:设置所要标注的位置坐标
#xytext:设置注释内容显示的起始位置
# arrowprops 用来设置箭头
# facecolor 设置箭头的颜色
# headlength 箭头的头的长度
# headwidth 箭头的宽度
# width 箭身的宽度
标签:span pyplot img 例子 lin 宽度 效果 inf ops
原文地址:https://www.cnblogs.com/pororo-dl/p/11747119.html