标签:系统 listen 适应 test byte 部署 工具 air manage
这次就不用 docker 部署服务了,这样大家会更容易接受。欢迎阅读。
Prometheus 是一个监控系统,也是一个时间序列数据库,用Go语言开发的,官方文档。通过从某些特定的目标如主机,Mysql,Redis等,收集带有时间标记的一些指标(metrics),比如服务器内存情况,数据库连接数量等数据,经过一定的处理,按照时间序列顺序进行显示。
你可以配置规则,对这些指标进行处理,当某些指标符合某种规则,会触发报警等。项目地址: https://github.com/prometheus/prometheus。Prometheus现在已经成为Kubernetes的官方监控方案,真棒。
为什么要用这个工具,因为我们有好多机器需要监控,我们要运维!而且雷锋们造了好多收集不同软件服务监控指标的工具,所以还是要用的。
这个工具号称:
说那么多,就是这个工具,你可以把它配置成单机器服务,也可以配置成分布式集群。
你可以去某些地方拉数据,也可以推数据给它,所有的请求都是HTTP协议,这样方便你定义自己的数据格式,制造一个造数据的服务,提供给Prometheus去拉或推。
你可以为Prometheus配置数据来源的静态地址,或者配置服务发现(啥是服务发现,就是现在我的数据提供的服务名是ServiceABC,它在A机器也可能在B机器,就是不知道它在哪里,服务发现会告诉你它现在在哪里),它就知道去哪里把指标数据拉下来。而且,它有各种可视化贼漂亮的UI组件支持。
Grafana是什么呢?是一个跨平台的开源的度量分析和可视化工具,用Go语言开发的,官网文档,可以通过将采集的数据查询然后可视化的展示。数据源可以来自Graphite,InfluxDB,OpenTSDB,Prometheus,Elasticsearch,CloudWatch和KairosDB等。项目地址:https://github.com/grafana/grafana
Prometheus的UI界面还是很丑,Grafana很漂亮,嗯,这很好,所以大家一起搭配干活,当然Grafana其实有时候并不需要Prometheus,它自己可以配置去监控各种数据库,Prometheus只是它的数据源。
时间序列的数据从哪里来,Prometheus 只是收集数据的,它要去某些地方拉数据,所以要有一些可以提供数据的服务。当然,你可以自己制作自己的数据服务。
官网提供了一些造数据的服务。先来看一个最基本的:机器节点指标导出服务:node_exporter,可以导出机器CPU,内存等使用情况。
我们来进行尝试。
你可以在这里下载合适你操作系统的最新node_exporter。
我是Mac苹果系统,所以下载了https://github.com/prometheus/node_exporter/releases/download/v0.18.1/node_exporter-0.18.1.darwin-amd64.tar.gz。
解压后就可以用了:
tar xvf node_exporter-0.18.1.darwin-amd64.tar.gz
cd node_exporter-0.18.1.darwin-amd64

./node_exporter
INFO[0000] Starting node_exporter (version=0.18.1, branch=HEAD, revision=3db77732e925c08f675d7404a8c46466b2ece83e)  source="node_exporter.go:156"
INFO[0000] Build context (go=go1.11.10, user=root@4a30727bb68c, date=20190604-16:47:36)  source="node_exporter.go:157"
INFO[0000] Enabled collectors:                           source="node_exporter.go:97"
INFO[0000]  - boottime                                   source="node_exporter.go:104"
INFO[0000]  - cpu                                        source="node_exporter.go:104"
INFO[0000]  - diskstats                                  source="node_exporter.go:104"
INFO[0000]  - filesystem                                 source="node_exporter.go:104"
INFO[0000]  - loadavg                                    source="node_exporter.go:104"
INFO[0000]  - meminfo                                    source="node_exporter.go:104"
INFO[0000] Listening on :9100                            source="node_exporter.go:170"
这个数据服务暴露了 9100 端口给 Prometheus 取数据。
打开 http://127.0.0.1:9100/metrics可以看到这个node_exporter提供的数据指标是怎么样的:
# HELP node_network_receive_bytes_total Network device statistic receive_bytes.
# TYPE node_network_receive_bytes_total counter  这个counter表示只增长的类型,也就是只会增加不会减少的值,且数值只能是正整数。大数值会启用科学计数法。
node_network_receive_bytes_total{device="XHC20"} 0
node_network_receive_bytes_total{device="awdl0"} 3072
node_network_receive_bytes_total{device="bridge0"} 0
node_network_receive_bytes_total{device="en0"} 0
node_network_receive_bytes_total{device="en1"} 4.133417984e+09

# HELP node_cpu_seconds_total Seconds the cpus spent in each mode.
# TYPE node_cpu_seconds_total counter
node_cpu_seconds_total{cpu="0",mode="idle"} 42696.99
node_cpu_seconds_total{cpu="0",mode="nice"} 0
node_cpu_seconds_total{cpu="0",mode="system"} 9593.58
node_cpu_seconds_total{cpu="0",mode="user"} 27073.77上面两行是注释说明,HELP是指标说明,TYPE是值类型。指标定义是这种格式的:指标名{key1="value1",key2="value2"} value,大括号里是指标下面的细分,你可以认为是二级指标。
说明node_network_receive_bytes_total这个大指标是统计机器网络接收字节数的,大指标下面有小指标,如网卡en0,en1等,后面的数字表示具体的值:接收字节数。
参考一下架构图说清楚Prometheus怎么用这些数据:
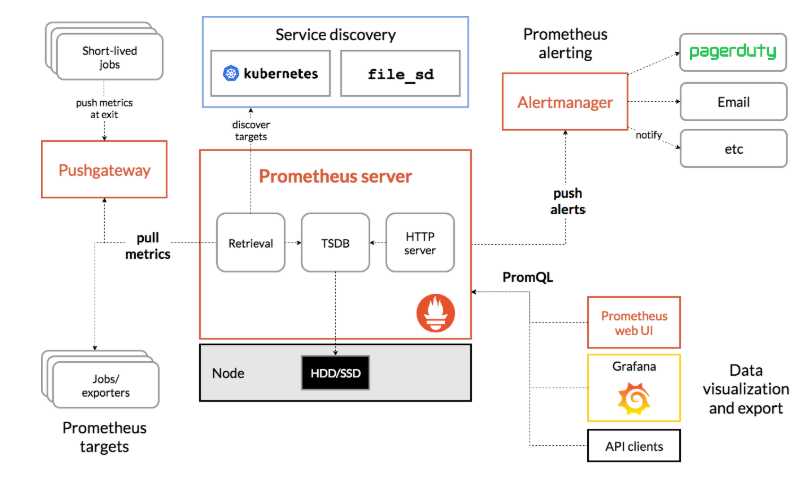
jobs/exporter称之为导出器,上面我们使用的node_exporter 就是属于这部分,是Prometheus主要的指标来源。Prometheus Server是服务核心组件,存储使用时序数据库TSDB将数据保存在硬盘上,由于官方对SSD做了专门的优化,所以使用SSD性能会更优。Service dicovery服务发现,配置Prometheus可以直接在写在yaml文件中,但如果配置较长也可以写入其他文件并启用文件发现(file_sd)功能让其自行侦听配置文件变化,甚至可以使用consul或者kubernetes这样的服务发现来动态更新配置以适应频繁的节点变更。Prometheus使用pull模型从节点暴露出来的端口拉取配置,这相比push方式更容易避免节点异常带来的干扰和繁琐的工作。Pushgateway类似于一个中转站,Prometheus的服务端只会使用pull方式拉取数据,但是某些节点因为某些原因只能使用push方式推送数据,所以这是一个存放推送数据的中转站。Alertmanager是一个告警系统,可以通过在配置文件中添加规则的方式,计算并发出警报,它支持多种发送方式比如Email等。Prometheus提供了PromQL语言进行查询,并自带了一个简易的UI界面,可以在界面上进行查询、绘图、查看配置、告警等等。当然,现在都用Grafana这个更漂亮的工具来查了。一句话,Prometheus可以从某些地方获取到监控数据,并且存起来,配套Grafana等客户端工具,你可以轻松监控,无烦恼。
下面我们进行集成,首先到官网下载Prometheus,我是Mac苹果系统,所以下载了https://github.com/prometheus/prometheus/releases/download/v2.12.0/prometheus-2.12.0.darwin-amd64.tar.gz。
解压后就可以用了:
tar xvfz prometheus-*.tar.gz
cd prometheus-*

./prometheus默认情况下,Prometheus监控自己,我们需要让它监控其他的人,编辑配置文件prometheus.yml:
vim prometheus.yml

# my global config
global:
  scrape_interval:     15s # Set the scrape interval to every 15 seconds. Default is every 1 minute. 每15秒抓一次数据
  evaluation_interval: 15s # Evaluate rules every 15 seconds. The default is every 1 minute.
  # scrape_timeout is set to the global default (10s).

# Alertmanager configuration
alerting:
  alertmanagers:
  - static_configs:
    - targets:
      # - alertmanager:9093

# Load rules once and periodically evaluate them according to the global 'evaluation_interval'.
rule_files:
  # - "first_rules.yml"
  # - "second_rules.yml"

# A scrape configuration containing exactly one endpoint to scrape:
# Here it's Prometheus itself.
scrape_configs:
  # The job name is added as a label `job=<job_name>` to any timeseries scraped from this config.
  - job_name: 'prometheus'

    # metrics_path defaults to '/metrics'
    # scheme defaults to 'http'.

    static_configs:
    - targets: ['localhost:9090']

  # 我们加了这个,填入node_exporter暴露出的端口
  - job_name: "node"
    static_configs:
    - targets: ["127.0.0.1:9100"]
然后执行:
# By default, Prometheus stores its database in ./data (flag --storage.tsdb.path).
./prometheus --config.file=prometheus.yml

level=info ts=2019-09-11T06:41:06.459Z caller=main.go:740 msg="Loading configuration file" filename=prometheus.yml
level=info ts=2019-09-11T06:41:46.492Z caller=main.go:768 msg="Completed loading of configuration file" filename=prometheus.yml
level=info ts=2019-09-11T06:41:46.492Z caller=main.go:623 msg="Server is ready to receive web requests."默认指标数据会保存在当前目录./data下。我们打开 http://127.0.0.1:9090查看Prometheus。
在http://127.0.0.1:9090/targets可以看到我们监控的模板,State绿色表示是健康的。
在http://127.0.0.1:9090/graph点击选择insert metric at cursor可以下拉指标,查看具体数据,如下图:
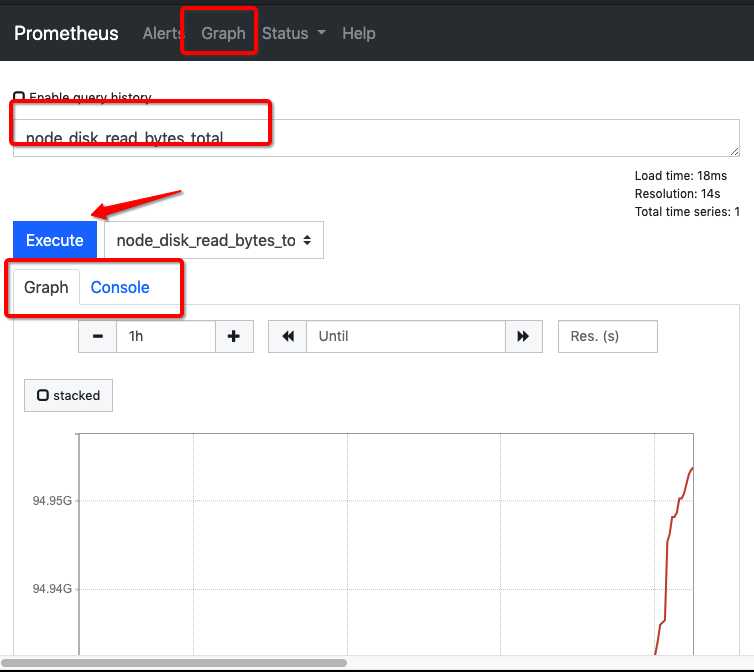
当然你也可以自己输入:node_cpu_seconds_total{cpu="0",mode="idle"},查出 CPU0每一次空闲的秒数,Console会显示出 node_cpu_seconds_total{cpu="0",instance="127.0.0.1:9100",job="node",mode="idle"} 46541.04。
计算出CPU所有核数的busy状态总和在整个CPU时间的占比可以用更复杂的表达式:
(((count(count(node_cpu_seconds_total) by (cpu))) - avg(sum by (mode)(irate(node_cpu_seconds_total{mode='idle'}[5m])))) * 100) / count(count(node_cpu_seconds_total) by (cpu))学习PromQL (Prometheus Query Language)。但我们并不关心这些复杂的表达式,因为有人帮我们把这些都做好了,上Grafana!!里面有好多插件帮你集成了。
先到https://grafana.com/grafana/download/6.3.5下载我们想要的包。
我是Mac方式安装,其他操作系统请参考其他安装方法,我这样做:
brew update
brew install grafana

brew tap homebrew/services
brew services start grafana
我们打开 http://127.0.0.1:3000查看Grafana,第一次账号密码:admin/admin。
添加数据源,点击 Add data source,选择Prometheus,在URL输入框键入http://127.0.0.1:9090,点击save & test,如果出现下图中的绿色提示,则表示配置有效,否则可能是地址或者端口等其他错误,需要自行修改。
点击左侧的Home回到首页,创建Dashboard,搜索相应的 Node Exporter,有一堆东西出来,跟着他们的提示做,最后就出来很漂亮的监控画面了。
可以参考这个文章:Book
Prometheus官方推荐了一些监控导出器:EXPORTERS。
Grafana官方推荐了一些数据源Data Source。
搭配这两个一起干活,可以组合出很多种监控方案。具体请查看官方文档。
感谢您的阅读,再见??。
标签:系统 listen 适应 test byte 部署 工具 air manage
原文地址:https://www.cnblogs.com/nima/p/11751307.html