标签:索引 live query cal xpl 过多 pre 应该 查询系统
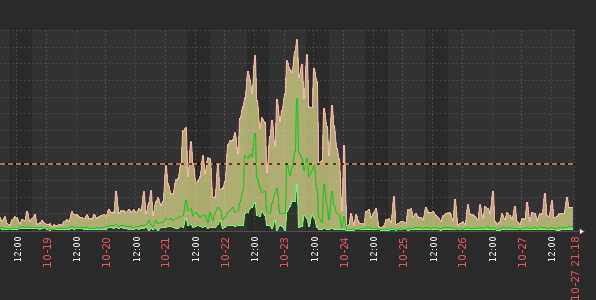
晚上9点,现场报系统查询慢,运维查询zabbix后发现postgres最近几天的IOWait很大
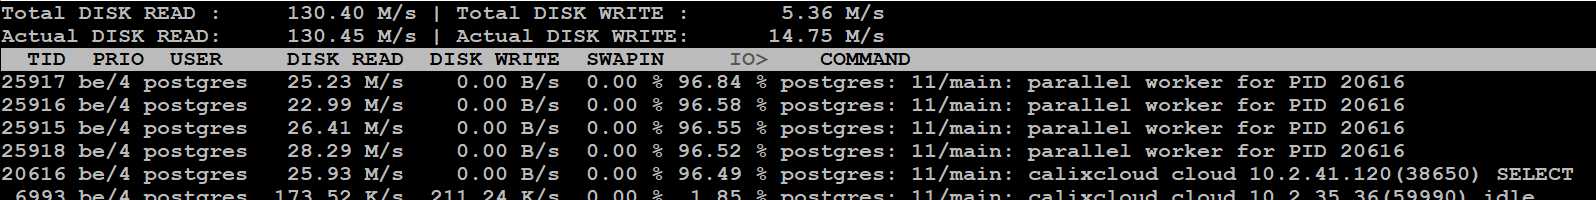
查询数据库,发现很多SQL堵住了
原因是真正创建index,导致表锁住了,其他所有操作都block住了。 将这个操作取消掉后,发现系统自动将这个表进行autovacuum,很多SQL又堵住了。手工将vacuum停掉后,系统好了一点点,但还是较之前慢。
其中一个SQL 执行的频率很高,但一直需要执行很长时间:
19014 | sxacc-devices   | AccessShareLock          | PostgreSQL JDBC Driver | 2019-10-23 14:22:12.837273+00 | active | get_lock   | 00:00:21.477812 |
SELECT COUNT(*) FROM "sxacc-devices" t WHERE (t.info->>‘orgId‘)::text = ‘67572‘
AND (t.info->>‘modelName‘)::text = ‘804Mesh‘ AND (t.info->>‘manufacturer‘)::text = ‘Calix‘ AND (t.info->>‘productClass‘)::text = ‘804Mesh‘
AND (t.info->>‘hardwareVersion‘)::text = ‘3000276410‘ AND (t.info->>‘manufacturerOUI‘)::text = ‘44657F‘ AND (t.info->>‘softwareVersion‘)::text = ‘1.1.0.100‘
查询执行计划
cloud=# explain SELECT COUNT(*) FROM "sxacc-devices" t WHERE (t.info->>‘orgId‘)::text = ‘7583‘ AND (t.info->>‘modelName‘)::text = ‘804Mesh‘ AND (t.info->>‘manufacturer‘)::text = ‘Calix‘ AND (t.info->>‘productClass‘)::text = ‘804Mesh‘ AND (t.info->>‘hardwareVersion‘)::text = ‘3000276410‘ AND (t.info->>‘manufacturerOUI‘)::text = ‘CCBE59‘ AND (t.info->>‘softwareVersion‘)::text = ‘2.0.1.112‘;
                                                                                                                                            QUERY PLAN
---------------------------------------------------------------------------------------------------------------------------------------------------------------------------------------------------------------------------------------------------------------------------------------------------
 Aggregate  (cost=2368.56..2368.57 rows=1 width=8)
   ->  Bitmap Heap Scan on "sxacc-devices" t  (cost=2273.58..2368.56 rows=1 width=0)
         Recheck Cond: (((info ->> ‘softwareVersion‘::text) = ‘2.0.1.112‘::text) AND ((info ->> ‘modelName‘::text) = ‘804Mesh‘::text))
         Filter: (((info ->> ‘orgId‘::text) = ‘7583‘::text) AND ((info ->> ‘productClass‘::text) = ‘804Mesh‘::text) AND ((info ->> ‘manufacturer‘::text) = ‘Calix‘::text) AND ((info ->> ‘hardwareVersion‘::text) = ‘3000276410‘::text) AND ((info ->> ‘manufacturerOUI‘::text) = ‘CCBE59‘::text))
         ->  BitmapAnd  (cost=2273.58..2273.58 rows=83 width=0)
               ->  Bitmap Index Scan on sv_idex  (cost=0.00..460.69 rows=3418 width=0)
                     Index Cond: ((info ->> ‘softwareVersion‘::text) = ‘2.0.1.112‘::text)
               ->  Bitmap Index Scan on idx_sxacc_devices_model_name  (cost=0.00..1812.65 rows=19706 width=0)
                     Index Cond: ((info ->> ‘modelName‘::text) = ‘804Mesh‘::text)
这个SQL还算可以,虽然不是每个字段都走index,但大部分也走索引了,但还是需要执行很长时间,而且Read很高
关键是查询select count(*) from "sxacc-devices"也非常慢,根本查不出来的样子。
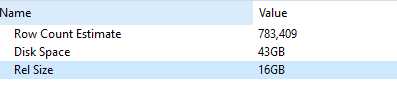
根据系统表查询这个表,发现总数据量只有78万多,但占用磁盘高达43GB,真实数据只有16GB,相差悬殊。
根据这个表的每小时统计信息发现一个奇怪的现象:
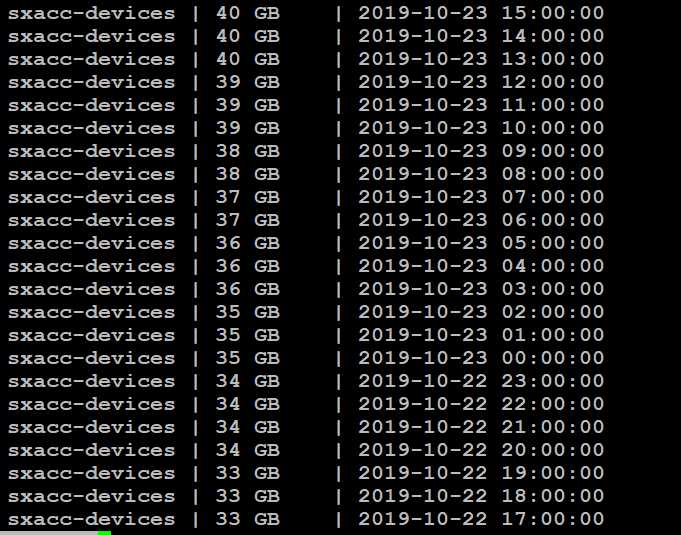
基本每3小时增长1GB,这是一个疯狂的操作。
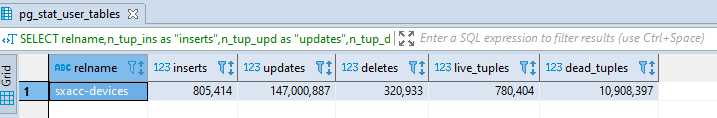
查询系统vacuum记录,发现这个表在昨天还做个autovacuum,查询
SELECT relname,n_tup_ins as "inserts",n_tup_upd as "updates",n_tup_del as "deletes", n_live_tup as "live_tuples", n_dead_tup as "dead_tuples" FROM pg_stat_user_tables where relname=‘sxacc-devices‘
这个表更新太过于频繁,决定手工vacuum一次, vacuum full analyze “sxacc-devices”, vacuum结束后发现这个表从40GB降到1GB. 执行完之后系统就回归正常。
分析:
由于这个表操作特别频繁,特别是更新过多,导致这个表的中间状态特别庞大,而autovacuum只会针对标识为删除的记录数进行删除,其他的不会做,导致这张表增长比较大。应该经常性的执行vacuum full去释放空间,但需要特别小心的是,但执行vacuum full的时候会进行表锁,导致操作这张表的sql block住,要特别小心。
查用查询:
--active 的sql及查询时间
SELECT t.relname, l.locktype, page, virtualtransaction, l.pid, mode, granted,a.state,a.client_addr,age(clock_timestamp(), a.query_start), a.usename, a.query
FROM pg_locks l, pg_stat_all_tables t,pg_stat_activity a
WHERE l.relation = t.relid and l.pid=a.pid ORDER BY relation asc;
--表大小统计
select pg_size_pretty (pg_total_relation_size (‘"sxacc-devices"‘)) as total,pg_size_pretty(pg_relation_size(‘"sxacc-devices"‘)) as relsize,  pg_size_pretty (pg_indexes_size(‘"sxacc-devices"‘)) as idx

--表查询效率统计
SELECT relname,n_tup_ins as "inserts",n_tup_upd as "updates",n_tup_del as "deletes", n_live_tup as "live_tuples", n_dead_tup as "dead_tuples" FROM pg_stat_user_tables where relname=‘sxacc-devices‘
Postgres IO:
https://blog.csdn.net/liyingke112/article/details/78844759
http://m.blog.chinaunix.net/uid-20726500-id-5741651.html
Postgres Vacuum:
https://www.cnblogs.com/gaojian/p/3272620.html
https://blog.csdn.net/pg_hgdb/article/details/79490875
https://confluence.atlassian.com/kb/optimize-and-improve-postgresql-performance-with-vacuum-analyze-and-reindex-885239781.html
https://www.percona.com/blog/2018/08/10/tuning-autovacuum-in-postgresql-and-autovacuum-internals/
https://www.postgresql.org/docs/9.5/routine-vacuuming.html
https://wiki.postgresql.org/wiki/VACUUM_FULL
https://wiki.postgresql.org/wiki/Introduction_to_VACUUM,_ANALYZE,_EXPLAIN,_and_COUNT
https://www.postgresql.org/docs/current/mvcc.html
标签:索引 live query cal xpl 过多 pre 应该 查询系统
原文地址:https://www.cnblogs.com/tben/p/11750886.html