标签:strong unzip debug lin nod 查看文件类型 nbsp 外部 title
在prometheus监控系统,prometheus的职责是采集,查询和存储和推送报警到alertmanager。本文主要介绍下prometheus的配置文件。

  # How frequently to scrape targets by default.
  [ scrape_interval: <duration> | default = 1m ]      # 抓取间隔

  # How long until a scrape request times out.
  [ scrape_timeout: <duration> | default = 10s ]     # 抓取超时时间

  # How frequently to evaluate rules.
  [ evaluation_interval: <duration> | default = 1m ]   # 评估规则间隔

  # The labels to add to any time series or alerts when communicating with
  # external systems (federation, remote storage, Alertmanager).
  external_labels:                                                  # 外部一些标签设置
    [ <labelname>: <labelvalue> ... ]
scrapy_config片段主要参数一个scrape_config 片段指定一组目标和参数, 目标就是实例,指定采集的端点, 参数描述如何采集这些实例, 主要参数如下
scrape_configs:
  # The job name is added as a label `job=<job_name>` to any timeseries scraped from this config.
  - job_name: ‘prometheus‘

    # metrics_path defaults to ‘/metrics‘
    # scheme defaults to ‘http‘.

    static_configs:
    - targets: [‘localhost:9090‘]
  - job_name: "node"
    static_configs:
    - targets:
      - "192.168.100.10:20001"
      - "192.168.100.11:20001
      - "192.168.100.12:20001"
scrape_configs:
  # The job name is added as a label `job=<job_name>` to any timeseries scraped from this config.
  - job_name: ‘prometheus‘

    # metrics_path defaults to ‘/metrics‘
    # scheme defaults to ‘http‘.

    static_configs:
    - targets: [‘localhost:9090‘]
  - job_name: "node"
    file_sd_configs:
    - refresh_interval: 1m
      files:
      - "/usr/local/prometheus/prometheus/conf/node*.yml"
 # 独立文件配置如下 cat conf/node-dis.conf

- targets:
  - "192.168.100.10:20001"
  - "192.168.100.11:20001"
  - "192.168.100.12:20001"

或者可以这样配置 [root@node00 conf]# cat node-dis.yml

- targets:
  - "192.168.100.10:20001"
  labels:
    hostname: node00
- targets:
  - "192.168.100.11:20001"
  labels:
    hostname: node01
- targets:
  - "192.168.100.12:20001"
  labels:
    hostname: node02
通过file_fd_files 配置后我们可以在不重启prometheus的前提下, 修改对应的采集文件(node_dis.yml), 在特定的时间内(refresh_interval),prometheus会完成配置信息的载入工作。
由于consul的配置需要有consul的服务提供, 这里简单部署下consul的服务。
# 进入下载目录
[root@node00 prometheus]# cd /usr/src/
# 下载
[root@node00 src]# wget https://releases.hashicorp.com/consul/1.6.1/consul_1.6.1_linux_amd64.zip
# 解压
[root@node00 src]# unzip consul_1.6.1_linux_amd64.zip
Archive:  consul_1.6.1_linux_amd64.zip
  inflating: consul
# 查看
[root@node00 src]# ls
consul  consul_1.6.1_linux_amd64.zip  debug  kernels  node_exporter-0.18.1.linux-amd64.tar.gz  prometheus-2.12.0.linux-amd64.tar.gz
# 查看文件类型
[root@node00 src]# file consul
consul: ELF 64-bit LSB executable, x86-64, version 1 (SYSV), statically linked, not stripped
# 防止到系统bin目录
[root@node00 src]# mv consul /usr/local/bin/
# 确保环境变量包含
[root@node00 src]# echo $PATH
/usr/local/sbin:/usr/local/bin:/usr/sbin:/usr/bin:/root/bin

# 运行测试
[root@node00 consul.d]# consul agent -dev
# 测试获取成员
[root@node00 ~]# consul members
# 创建配置目录
[root@node00 ~]#mkdir /etc/consul.d
[root@node00 consul.d]# cat prometheus-node.json
{
  "addresses": {
                        "http": "0.0.0.0",
                        "https": "0.0.0.0"
           },
  "services": [{
                "name": "prometheus-node",
                "tags": ["prometheus","node"],
                "port": 20001
             }]

}
# 指定配置文件运行
consul  agent -dev -config-dir=/etc/consul.d
打开web管理界面 192.169.100.10:8500,查看相应的服务信息。
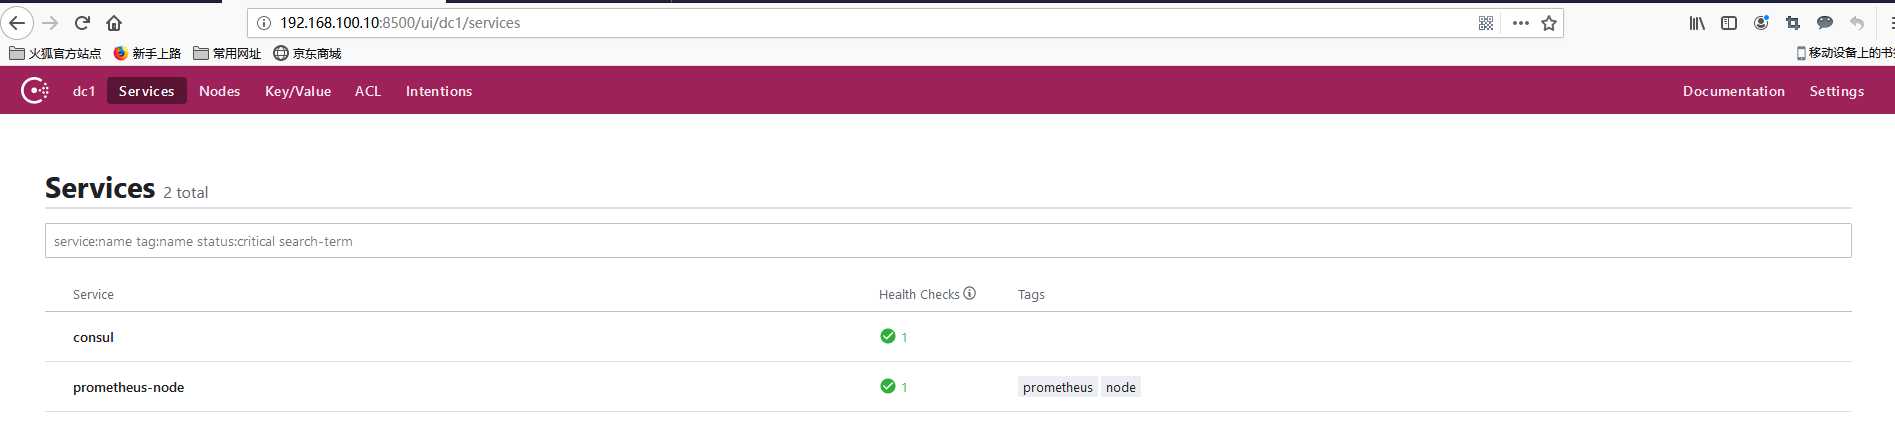
上面我们可以看到有2个service , 其中prometheus-node是我们定义的service。
和prometheus集成样例:
scrape_configs:
  # The job name is added as a label `job=<job_name>` to any timeseries scraped from this config.
  - job_name: ‘prometheus‘

    # metrics_path defaults to ‘/metrics‘
    # scheme defaults to ‘http‘.
    static_configs:
    - targets: [‘localhost:9090‘]

  - job_name: "node"
    consul_sd_configs:
    - server: localhost:8500
      services:
      - prometheus-node
    #  tags:
    #  - prometheus
    #  - node
    #- refresh_interval: 1m
  - job_name: ‘node_exporter‘
    consul_sd_configs:
      - server: ‘consul_ip:8500‘
        services: [‘node_exporter‘]
# 匹配service关键字
  - job_name: ‘service‘
    consul_sd_configs:
    - server: ‘consul_ip:8500‘
      services: []
    relabel_configs:
    - source_labels: [__meta_consul_tags]
      regex: .*service.*
      action: keep
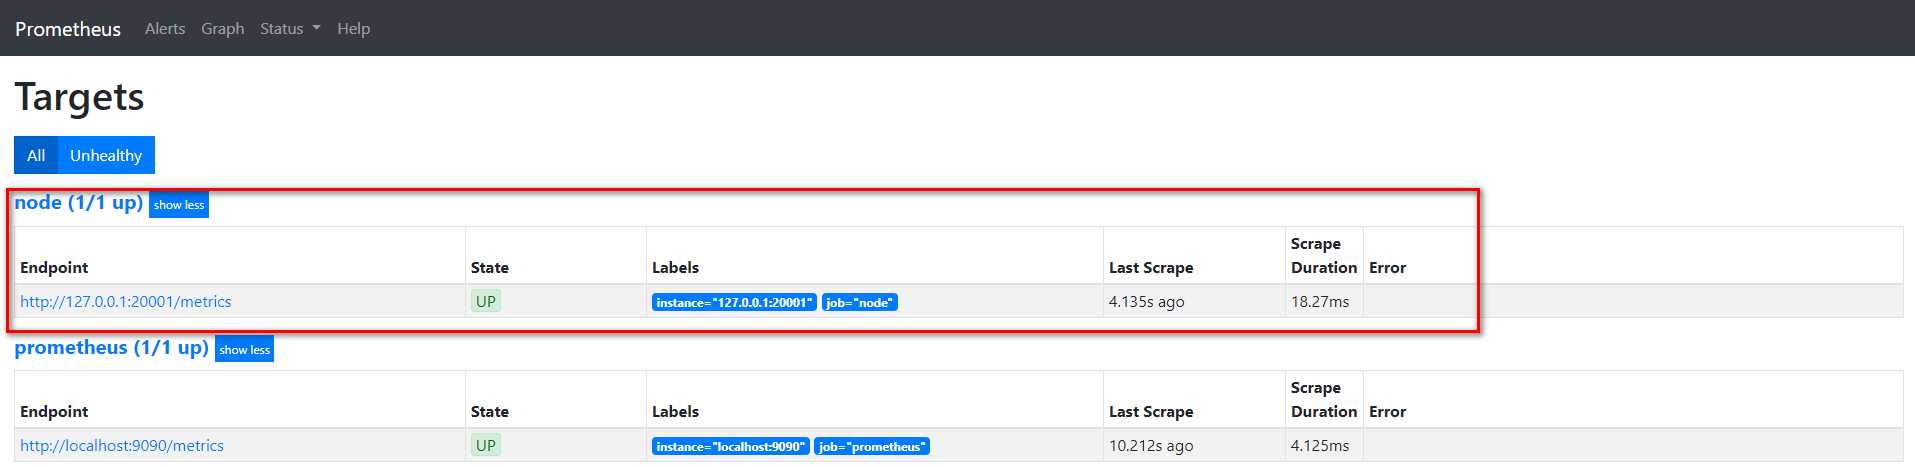
在prometheus的target界面上我们看到服务注册发现的结果。
我们通过api接口给该service添加一个节点, 看看是否可以同步过来。
[root@node00 ~]# curl -XPUT -d@node01.json  127.0.0.1:8500/v1/catalog/register
true
[root@node00 ~]# cat node01.json
{
        "id":"0cc931ea-9a3a-a6ff-3ef5-e0c99371d77d",
        "Node": "node01",
        "Address": "192.168.100.11",
        "Service":
                {
                        "Port": 20001,
                        "ID": "prometheus-node",
                        "Service": "prometheus-node"
                }
}
在consul和prometheus中查看
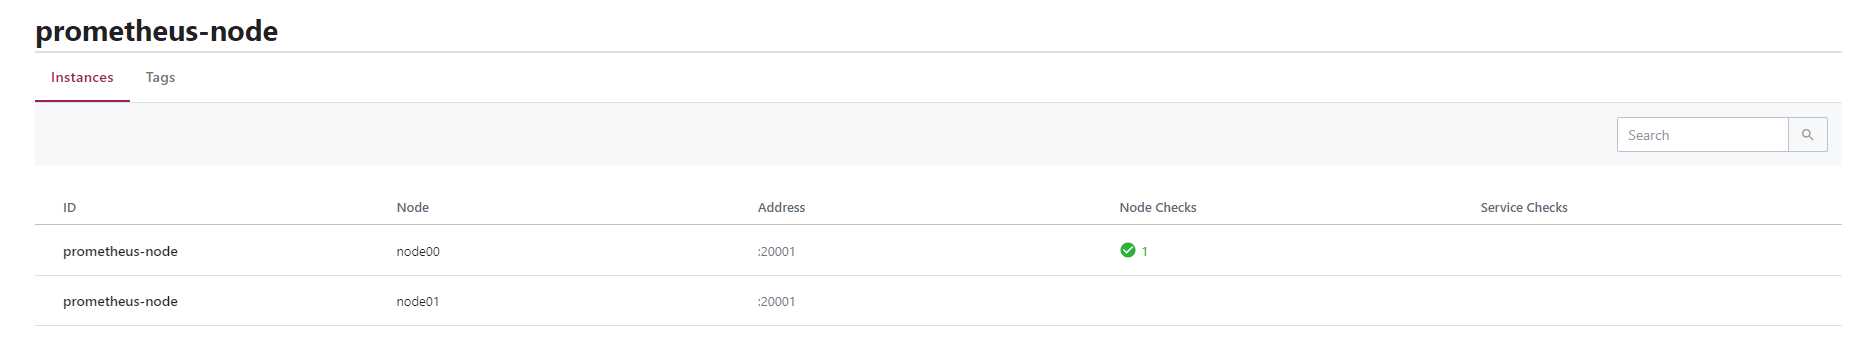
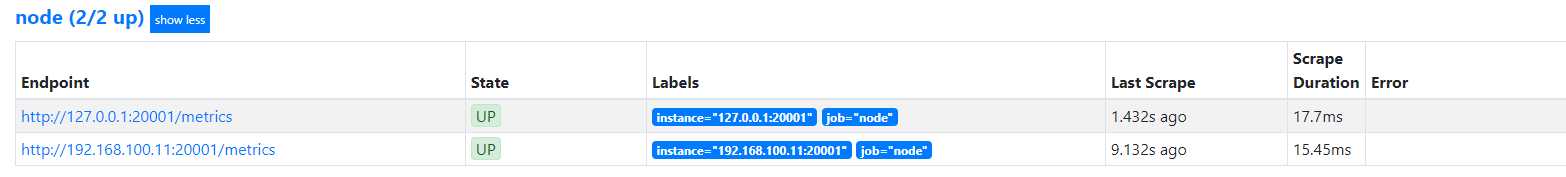
可以发现通过向consul中特定服务加入节点, 就可以在prometheus动态变动采集的实例地址。
标签:strong unzip debug lin nod 查看文件类型 nbsp 外部 title
原文地址:https://www.cnblogs.com/momoyan/p/11783519.html