标签:tools 工作 tag 服务 服务器 版本 color complete median
操作系统 : CentOS7.3.1611_x64
Python 版本 : 3.6.8
tornado版本:6.0.2
snaic版本:19.9.0
CPU : Intel(R) Core(TM) i5-2320 CPU @ 3.00GHz 4核
之前一直使用tornado作为http相关python程序的框架,最近查资料发现新出的snaic性能很高,这里在同样硬件条件下使用ab进行简单的压测。
安装apache ab工具:
yum -y install httpd-tools
压测命令:
ab -c 30 -n 100000 http://127.0.0.1:9093/
参数说明:
-c :模拟并发数
-n : 总请求数
使用tornado实现的简单http服务器代码:
https://github.com/mike-zhang/pyExamples/blob/master/httpRelate/httpServer/tornadoTest1.py
使用snaic实现的简单http服务器代码:
https://github.com/mike-zhang/pyExamples/blob/master/httpRelate/httpServer/snaicTest1.py
tornado测试结果:
Server Software:        TornadoServer/6.0.2
Server Hostname:        127.0.0.1
Server Port:            9093

Document Path:          /
Document Length:        12 bytes

Concurrency Level:      30
Time taken for tests:   82.282 seconds
Complete requests:      100000
Failed requests:        0
Write errors:           0
Total transferred:      20700000 bytes
HTML transferred:       1200000 bytes
Requests per second:    1215.33 [#/sec] (mean)
Time per request:       24.685 [ms] (mean)
Time per request:       0.823 [ms] (mean, across all concurrent requests)
Transfer rate:          245.68 [Kbytes/sec] received

Connection Times (ms)
                          min  mean[+/-sd] median   max
Connect:        0    0   0.2      0       8
Processing:     1   25  10.3     25      74
Waiting:        1   24  10.3     25      74
Total:          1   25  10.3     25      74

Percentage of the requests served within a certain time (ms)
  50%     25
  66%     30
  75%     33
  80%     34
  90%     37
  95%     39
  98%     41
  99%     42
 100%     74 (longest request)
snaic测试结果:
Server Software:
Server Hostname:        127.0.0.1
Server Port:            9093

Document Path:          /
Document Length:        12 bytes

Concurrency Level:      30
Time taken for tests:   20.164 seconds
Complete requests:      100000
Failed requests:        0
Write errors:           0
Total transferred:      11100000 bytes
HTML transferred:       1200000 bytes
Requests per second:    4959.29 [#/sec] (mean)
Time per request:       6.049 [ms] (mean)
Time per request:       0.202 [ms] (mean, across all concurrent requests)
Transfer rate:          537.58 [Kbytes/sec] received

Connection Times (ms)
                          min  mean[+/-sd] median   max
Connect:        0    2   0.5      2      11
Processing:     1    4   1.5      4      38
Waiting:        0    4   1.4      3      37
Total:          1    6   1.5      6      41

Percentage of the requests served within a certain time (ms)
  50%      6
  66%      6
  75%      7
  80%      7
  90%      7
  95%      8
  98%      9
  99%     10
 100%     41 (longest request)
从测试结果可以看到,开启两个进程情况下:
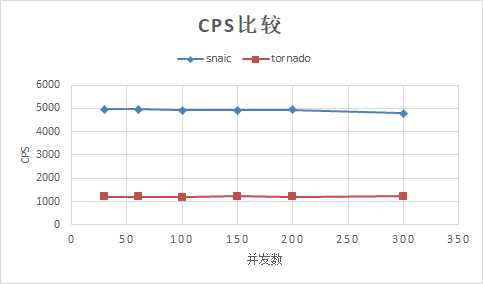
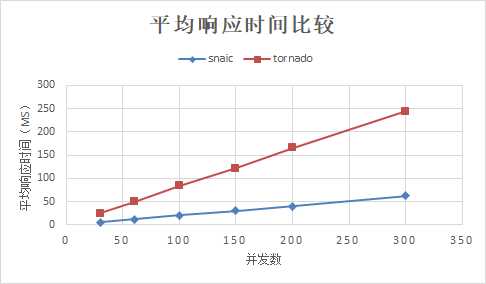
tornado的cps是 1215.33 ,平均响应时间是 24.685 ms
snaic的cps是 4959.29 ,平均响应时间是 6.049 ms
修改并发数后的测试数据如下:

测试结果对比如下:


从测试数据来看,snaic的cps比tornado高,平均响应时间方面,snaic也比tornado短。
本文github地址:
https://github.com/mike-zhang/mikeBlogEssays/blob/master/2019/20191102_snaic和tornado的简单性能测试.rst
欢迎补充
标签:tools 工作 tag 服务 服务器 版本 color complete median
原文地址:https://www.cnblogs.com/MikeZhang/p/snaic_vs_tornado_20191102.html