标签:enter tla 缓冲 不同 声音 运行 oid 移除 友好
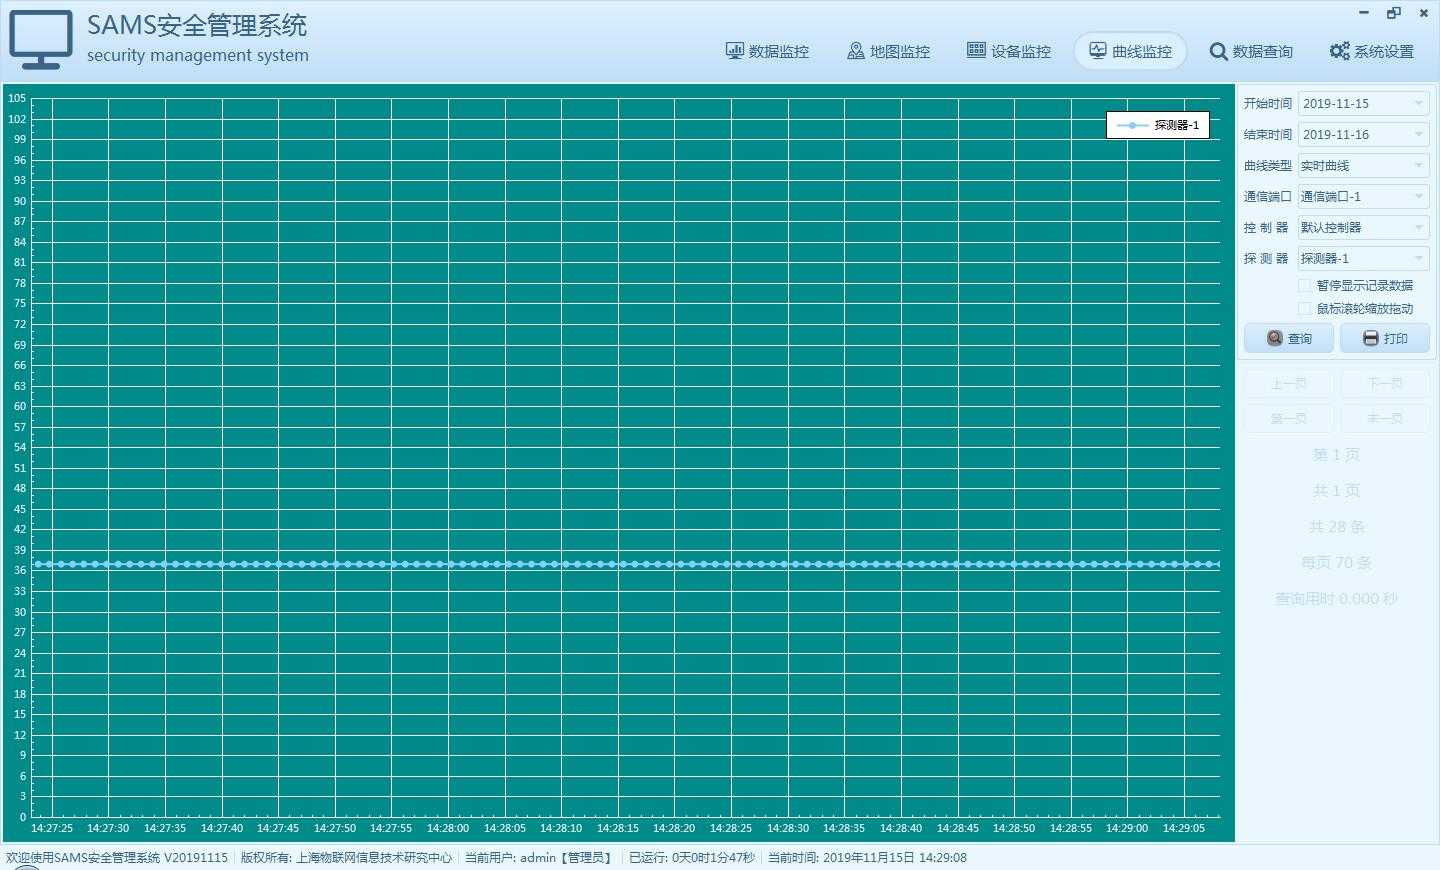
曲线监控模块用的很少,主要就是用来观察某个设备的实时采集的数据和历史采集的数据,可以回放数据,在右侧可以选择对应的通信端口和控制器,然后选择指定的探测器进行观察,从选择的时候开始计时,每个数据都对应一个数据点,至于采集间隔,这个在端口管理中设定的,一般来说都是1秒钟采集一次。
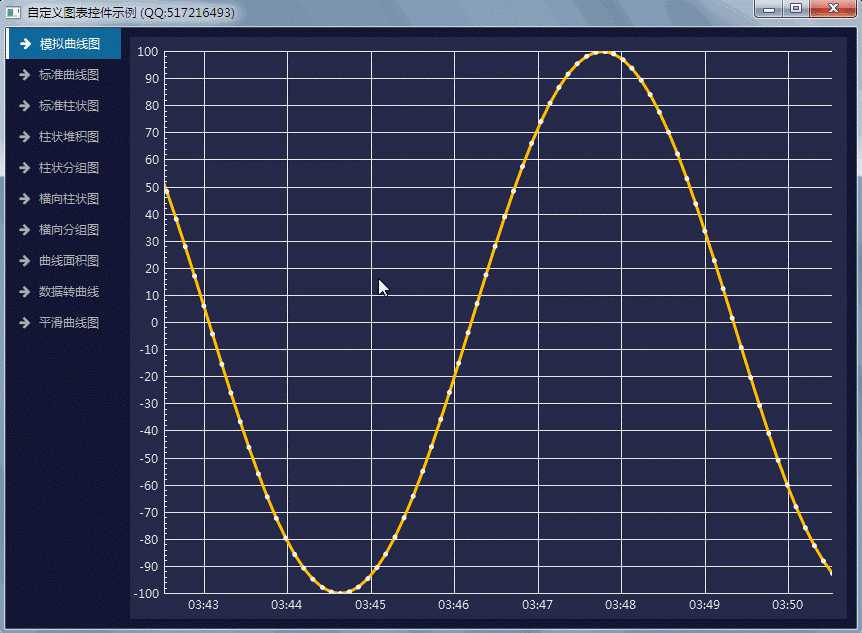
显示曲线图表控件,个人强烈推荐开源的qcustomplot或者qwt,Qt5.7以后集成了qchart模块也有曲线控件,个人觉得用法还是不够友好,而且很多人反映大数据量基本上歇菜,只能做一些小数据量的展示,我看过qchart模块的完整源码,写的不是很好,也许后期改进了不少,还是Qt4时代若基亚品质保证,代码质量都是杠杠的,可惜若基亚把Qt卖了。
皮肤开源:https://gitee.com/feiyangqingyun/QWidgetDemo https://github.com/feiyangqingyun/QWidgetDemo
文件名称:styledemo
体验地址:https://gitee.com/feiyangqingyun/QWidgetExe https://github.com/feiyangqingyun/QWidgetExe
文件名称:bin_sams.zip


void frmViewPlot::initPlot()
{
    ui->customPlot->addGraph();
    ui->customPlot->graph(0)->setName("浓度值");
    ui->customPlot->graph(0)->setPen(QPen(QColor(App::ColorPlotLine), LineWidth));
    ui->customPlot->graph(0)->setScatterStyle(QCPScatterStyle(QCPScatterStyle::ssCircle,
                                                              Qt::NoPen, QBrush(QColor(App::ColorPlotLine)), DotWidth));

    QFont font;
    font.setPixelSize(11);
    ui->customPlot->legend->setFont(font);
    ui->customPlot->xAxis->setLabelFont(font);
    ui->customPlot->yAxis->setLabelFont(font);
    ui->customPlot->xAxis->setTickLabelFont(font);
    ui->customPlot->yAxis->setTickLabelFont(font);

    ui->customPlot->xAxis->setTickLabelType(QCPAxis::ltDateTime);
    ui->customPlot->xAxis->setDateTimeFormat("hh:mm:ss");
    ui->customPlot->xAxis->setAutoTickStep(false);
    ui->customPlot->xAxis->setTickStep(TickStep);
    ui->customPlot->xAxis->setRange(0, XMax, Qt::AlignRight);
    ui->customPlot->yAxis->setRange(0, 100);
    ui->customPlot->legend->setVisible(true);

    QColor textColor = QColor(App::ColorPlotText);
    ui->customPlot->yAxis->setLabelColor(textColor);
    ui->customPlot->xAxis->setTickLabelColor(textColor);
    ui->customPlot->yAxis->setTickLabelColor(textColor);
    ui->customPlot->xAxis->setBasePen(QPen(textColor));
    ui->customPlot->yAxis->setBasePen(QPen(textColor));
    ui->customPlot->xAxis->setTickPen(QPen(textColor));
    ui->customPlot->yAxis->setTickPen(QPen(textColor));
    ui->customPlot->xAxis->setSubTickPen(QPen(textColor));
    ui->customPlot->yAxis->setSubTickPen(QPen(textColor));
    ui->customPlot->xAxis->grid()->setPen(QPen(textColor));
    ui->customPlot->yAxis->grid()->setPen(QPen(textColor));
    ui->customPlot->yAxis->grid()->setZeroLinePen(QPen(textColor));

    ui->customPlot->setBackground(QColor(App::ColorPlotBg));
    //ui->customPlot->xAxis->setTickLabelRotation(90);
    ui->customPlot->yAxis->setAutoTickCount(30);
    ui->customPlot->replot();
    //ui->customPlot->installEventFilter(this);
}

void frmViewPlot::loadPlot()
{
    //移除第一个数据,增加一个数据,保证每次集合数据一致
    labs.remove(0, 1);
    labs.append(TIME);
    values.remove(0, 1);
    values.append(currentValue);

    ui->customPlot->graph(0)->setData(keys, values);
    ui->customPlot->xAxis->setTickVector(keys);
    ui->customPlot->xAxis->setTickVectorLabels(labs);
    ui->customPlot->replot();
}

void frmViewPlot::initData()
{
    whereSql = "where 1=1";
    columnNames << "编号" << "位号" << "控制器名称" << "探测器名称" << "浓度值" << "气体符号" << "保存时间";
    columnWidths << 100 << 120 << 145 << 145 << 70 << 70 << 150;

    //设置需要显示数据的表格和翻页的按钮,最后一列自动填充,奇偶行不同颜色显示
    dbPage = new DbPage(this);
    dbPage->setAllCenter(true);
    dbPage->setColumnNames(columnNames);
    dbPage->setColumnWidths(columnWidths);
    dbPage->setResultCurrent(XMax2);
    dbPage->setTableName("NodeLog");
    dbPage->setOrderSql(QString("LogID %1").arg(App::AlarmLogOrder));
    dbPage->setControl(ui->tableView, ui->labPageCount, ui->labPageCurrent, ui->labResultCount, ui->labResultCurrent, ui->labResult, 0,
                       ui->btnFirst, ui->btnPre, ui->btnNext, ui->btnLast, "LogID");

    dbPage->setWhereSql(whereSql);
    dbPage->select();

    //绑定按钮切换载入数据
    connect(ui->btnFirst, SIGNAL(clicked()), this, SLOT(loadData()));
    connect(ui->btnPre, SIGNAL(clicked()), this, SLOT(loadData()));
    connect(ui->btnNext, SIGNAL(clicked()), this, SLOT(loadData()));
    connect(ui->btnLast, SIGNAL(clicked()), this, SLOT(loadData()));
}

void frmViewPlot::loadData()
{
    keys.clear();
    labs.clear();
    values.clear();

    //加载当前表格中的数据
    QAbstractItemModel *model = ui->tableView->model();
    int count = model->rowCount();
    for (int i = 0; i < count; i++) {
        QModelIndex modelIndex = model->index(i, 4);
        QModelIndex labIndex = model->index(i, 6);
        double value = model->data(modelIndex).toDouble();
        QString strDate = model->data(labIndex).toString().right(8);

        keys << i;
        labs << strDate;
        values << value;
    }

    ui->customPlot->graph(0)->setData(keys, values);
    ui->customPlot->xAxis->setTickVector(keys);
    ui->customPlot->xAxis->setTickVectorLabels(labs);
    ui->customPlot->replot();
}

void frmViewPlot::receiveValue(const QString &positionID, float value)
{
    if (ui->ckPause->isChecked()) {
        return;
    }

    //必须是实时曲线才需要显示
    if (ui->cboxType->currentText() != "实时曲线") {
        return;
    }

    //找到当前位号对应的索引,取出对应索引位置的值
    QString id = ui->cboxNodeName->itemData(ui->cboxNodeName->currentIndex()).toString();
    if (id != positionID) {
        return;
    }

    currentValue = value;

    //以下增加部分为将接收数据曲线显示
    QVector<double> keys;
    QVector<double> datas;
    double key = QDateTime::currentDateTime().toMSecsSinceEpoch() / 1000.0;
    keys.append(key);
    datas.append(currentValue);

    ui->customPlot->graph(0)->addData(keys, datas);
    ui->customPlot->graph(0)->removeDataBefore(key - XMax);
    ui->customPlot->xAxis->setRange(key, XMax, Qt::AlignRight);
    ui->customPlot->replot();
}

void frmViewPlot::receiveValue(const QString &portName, quint8 addr, const QList<float> &values)
{
    if (ui->ckPause->isChecked()) {
        return;
    }

    //必须是实时曲线才需要显示
    if (ui->cboxType->currentText() != "实时曲线") {
        return;
    }

    //过滤端口
    if (ui->cboxPortName->currentText() != portName) {
        return;
    }

    //过滤设备
    if (ui->cboxDeviceName->itemData(ui->cboxDeviceName->currentIndex()).toInt() != addr) {
        return;
    }

    //找到当前位号对应的索引,取出对应索引位置的值
    QString positionID = ui->cboxNodeName->itemData(ui->cboxNodeName->currentIndex()).toString();
    //找到当前索引位置的设备地址对应探测器的最小寄存器地址
    //如果读取的起始寄存器地址是5则回来的数据位第一个是寄存器地址5的数据,后面连续
    quint16 nodeMinAddr = DBHelper::getNodeMinAddr(portName, addr);
    int index = DBData::NodeInfo_PositionID.indexOf(positionID);
    int startIndex = DBData::NodeInfo_NodeAddr.at(index) - nodeMinAddr - 1;
    //有时候可能出现总共添加了8个探测器但是真实读到4个探测器的情况
    if (startIndex >= values.count()) {
        return;
    }

    currentValue = values.at(startIndex);

    //以下增加部分为将接收数据曲线显示
    QVector<double> keys;
    QVector<double> datas;
    double key = QDateTime::currentDateTime().toMSecsSinceEpoch() / 1000.0;
    keys.append(key);
    datas.append(currentValue);

    ui->customPlot->graph(0)->addData(keys, datas);
    ui->customPlot->graph(0)->removeDataBefore(key - XMax);
    ui->customPlot->xAxis->setRange(key, XMax, Qt::AlignRight);
    ui->customPlot->replot();
}标签:enter tla 缓冲 不同 声音 运行 oid 移除 友好
原文地址:https://www.cnblogs.com/feiyangqingyun/p/11871476.html