标签:items init data code clip render rom 详情 alac
tooltip: { // 提示框组件
trigger: ‘item‘,
formatter: function (params) {
// console.log(params.data)
var returnData = ‘‘
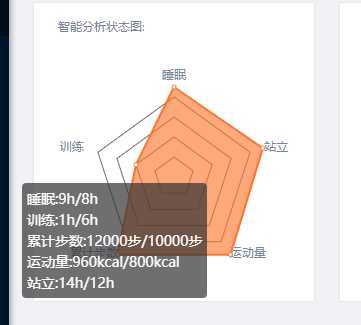
returnData += ‘睡眠:‘ + params.data.value[0] + ‘h/8h‘ + ‘<br/>‘ + ‘训练:‘ + params.data.value[1] + ‘h/6h‘ + ‘<br/>‘ + ‘累计步数:‘ + params.data.value[2] + ‘步/10000步‘ + ‘<br/>‘ + ‘运动量:‘ + params.data.value[3] + ‘kcal/800kcal‘ + ‘<br/>‘ + ‘站立:‘ + params.data.value[4] + ‘h/12h‘ + ‘<br/>‘
return returnData
}
},
import myEcharts from ‘echarts‘
const xAxisData = []
const xAxisHeartData = []
// let yAxisData = []
export let heartRateData = []
export const stepNumData = [
[0, 0],
[1, 0],
[2, 0],
[3, 0],
[4, 0],
[5, 0],
[6, 0],
[7, 0],
[8, 0],
[9, 0],
[10, 0],
[11, 0],
[12, 0],
[13, 0],
[14, 0],
[15, 0],
[16, 0],
[17, 0],
[18, 0],
[19, 0],
[20, 0],
[21, 0],
[22, 0],
[23, 0]
]
export const trainTimeData = [
[0, 0],
[1, 0],
[2, 0],
[3, 0],
[4, 0],
[5, 0],
[6, 0],
[7, 0],
[8, 0],
[9, 0],
[10, 0],
[11, 0],
[12, 0],
[13, 0],
[14, 0],
[15, 0],
[16, 0],
[17, 0],
[18, 0],
[19, 0],
[20, 0],
[21, 0],
[22, 0],
[23, 0]
]
export let sleepTimeData = []
export const activityConsumptionData = [
[0, 0],
[1, 0],
[2, 0],
[3, 0],
[4, 0],
[5, 0],
[6, 0],
[7, 0],
[8, 0],
[9, 0],
[10, 0],
[11, 0],
[12, 0],
[13, 0],
[14, 0],
[15, 0],
[16, 0],
[17, 0],
[18, 0],
[19, 0],
[20, 0],
[21, 0],
[22, 0],
[23, 0]
]
export const standTimeData = [
[0, 0],
[1, 0],
[2, 0],
[3, 0],
[4, 0],
[5, 0],
[6, 0],
[7, 0],
[8, 0],
[9, 0],
[10, 0],
[11, 0],
[12, 0],
[13, 0],
[14, 0],
[15, 0],
[16, 0],
[17, 0],
[18, 0],
[19, 0],
[20, 0],
[21, 0],
[22, 0],
[23, 0]
]
export const distanceData = [
[0, 0],
[1, 0],
[2, 0],
[3, 0],
[4, 0],
[5, 0],
[6, 0],
[7, 0],
[8, 0],
[9, 0],
[10, 0],
[11, 0],
[12, 0],
[13, 0],
[14, 0],
[15, 0],
[16, 0],
[17, 0],
[18, 0],
[19, 0],
[20, 0],
[21, 0],
[22, 0],
[23, 0]
]
export const climbData = [
[0, 0],
[1, 0],
[2, 0],
[3, 0],
[4, 0],
[5, 0],
[6, 0],
[7, 0],
[8, 0],
[9, 0],
[10, 0],
[11, 0],
[12, 0],
[13, 0],
[14, 0],
[15, 0],
[16, 0],
[17, 0],
[18, 0],
[19, 0],
[20, 0],
[21, 0],
[22, 0],
[23, 0]
]
// export const radarData = [
// {
// value: [0, 0, 0, 0, 0],
// name: ‘日生命体征‘
// }
// ]
for (let i = 0; i < 24; i++) {
if (i < 10) {
xAxisData.push(‘0‘ + i + ‘:00‘)
} else {
xAxisData.push(i + ‘:00‘)
}
}
for (let i = 0; i < 24; i++) {
let hour = ‘‘
let min = ‘‘
let time
for (let j = 0; j < 60; j++) {
hour = i < 10 ? (‘0‘ + i) : i
min = j < 10 ? (‘0‘ + j) : j
time = hour.toString() + ‘:‘ + min.toString()
xAxisHeartData.push(time)
}
}
const xHeartAxis = {
data: xAxisHeartData,
axisLabel: {
interval: (index, value) => {
switch (value) {
case ‘00:00‘:
return true
case ‘06:00‘:
return true
case ‘12:00‘:
return true
case ‘18:00‘:
return true
case ‘23:59‘:
return true
}
},
textStyle: {
color: ‘#78849E‘
}
},
axisLine: {
show: false,
lineStyle: {
color: ‘#707070‘
}
},
axisTick: {
lineStyle: {
width: 0
}
}
}
const xAxis = {
data: xAxisData,
axisLabel: {
interval: (index, value) => {
switch (value) {
case ‘00:00‘:
return true
case ‘06:00‘:
return true
case ‘12:00‘:
return true
case ‘18:00‘:
return true
case ‘23:00‘:
return true
}
},
textStyle: {
color: ‘#78849E‘
}
},
axisLine: {
show: false,
lineStyle: {
color: ‘#707070‘
}
},
axisTick: {
lineStyle: {
width: 0
}
}
}
export const setHeartData = (data) => {
heartRateData = data
}
export const resetSleepDate = () => {
sleepTimeData = []
}
export const heartRate = (id) => {
var totalFlowRate = myEcharts.init(document.getElementById(id))
var totalFlowRateOption = {
animation: false,
tooltip: {
trigger: ‘axis‘,
axisPointer: { // 坐标轴指示器,坐标轴触发有效
type: ‘shadow‘ // 默认为直线,可选为:‘line‘ | ‘shadow‘
},
formatter: (params) => {
const tar = params[0]
return tar.name + ‘<br/>‘ + tar.seriesName + ‘ : ‘ + tar.value[1]
}
},
grid: {
height: ‘70%‘,
width: ‘92%‘,
containLabel: true,
bottom: ‘5%‘,
left: ‘1%‘/* "单位px" */
},
xAxis: xHeartAxis,
yAxis: {
axisLabel: {
textStyle: {
color: ‘#78849E‘
}
},
axisLine: {
show: false,
lineStyle: {
color: ‘#707070‘
}
},
splitLine: {
lineStyle: {
color: ‘#707070‘
}
}
},
series: {
name: ‘心率‘,
type: ‘line‘,
/* symbolSize: 3, */
itemStyle: {
color: ‘rgba(254,210,208,0)‘
},
areaStyle: {
color: new myEcharts.graphic.LinearGradient(0, 0, 0, 1, [{
offset: 0,
color: ‘rgb(255,0,0)‘
}, {
offset: 1,
color: ‘rgb(255,89,101)‘
}])
},
data: heartRateData,
showSymbol: false
/* smooth:true//0-1之间的数字或true或false,显示为平滑的曲线 */
}
}
if (JSON.stringify(heartRateData) === ‘[]‘) {
totalFlowRateOption.yAxis.max = 200
totalFlowRateOption.yAxis.min = 0
}
totalFlowRate.setOption(totalFlowRateOption)
window.addEventListener(‘resize‘, totalFlowRate.resize)
}
// 设置雷达图指示
export const indicator = [
{ text: ‘睡眠‘, max: 8 },
{ text: ‘训练‘, max: 6 },
{ text: ‘累计步数‘, max: 10000 },
{ text: ‘运动量‘, max: 800 },
{ text: ‘站立‘, max: 12 }
]
// 设置雷达图目标
export function setRadarTarget () {
const target = {
stepCountTarget: 10000,
trainTimeTarget: 2,
sleepTimeTarget: 8,
activityConsumptionTarget: 800,
standTimeTarget: 12,
distanceRangeTarget: 3,
climbRangeTarget: 50
}
indicator[0].max = target.sleepTimeTarget
indicator[1].max = target.trainTimeTarget
indicator[2].max = target.stepCountTarget
indicator[3].max = target.activityConsumptionTarget
indicator[4].max = target.standTimeTarget
}
// 制作雷达图数据
export function setRadarData (input) {
// console.log(trainTime)
// const sleepRadar, trainRadar, stepRadar, calRadar, standRadar
const sleepRadar = input.sleepTime > indicator[0].max ? (indicator[0].max + indicator[0].max * 0.2) : input.sleepTime
const trainRadar = input.trainTime > indicator[1].max ? (indicator[1].max + indicator[1].max * 0.2) : input.trainTime
const stepRadar = input.stepCount > indicator[2].max ? indicator[2].max + indicator[2].max * 0.2 : input.stepCount
const calRadar = input.activityConsumption > indicator[3].max ? indicator[3].max + indicator[3].max * 0.2 : input.activityConsumption
const standRadar = input.standTime > indicator[4].max ? indicator[4].max + indicator[4].max * 0.2 : input.standTime
// radarData[0].value = [sleepRadar, trainRadar, stepRadar, calRadar, standRadar]
const radarData = [sleepRadar, trainRadar, stepRadar, calRadar, standRadar]
return radarData
}
// 返回雷达图数据/options
export function myRadar (input) {
// eslint-disable-next-line // key: [‘睡眠/实际‘, ‘训练/实际‘, ‘累计步数/实际‘, ‘运动量/实际‘, ‘‘]
const radarData = [{
value: [0, 0, 0, 0, 0],
name: ‘实际详情‘
}]
console.log(‘myRadar input: ‘, input)
if (input.stepCount) {
console.log(‘setRadarData(input): ‘, setRadarData(input))
radarData[0].value = setRadarData(input)
radarData[0].value = [parseInt(radarData[0].value[0]), parseInt(radarData[0].value[1]), parseInt(radarData[0].value[2]), parseInt(radarData[0].value[3]), parseInt(radarData[0].value[4])]
// console.log(radarData[0].value)
setRadarTarget()
}
const options = {
tooltip: {
trigger: ‘axis‘
},
radar: {
indicator: indicator, // 雷达图的指示器
splitNumber: 4,
radius: 80,
nameGap: 15,
// shape: ‘circle‘, // 雷达图绘制类型,圆形
splitArea: { // 坐标轴在 grid 区域中的分隔区域,默认不显示。
show: false
},
axisLine: { // 坐标轴轴线相关设置
show: false
},
splitLine: { // 坐标轴在 grid 区域中的分隔线
lineStyle: {
color: ‘#707070‘
}
},
name: { // 雷达图每个指示器名称的配置项str.split("?")[0]
formatter: ‘{value}‘, // 使用字符串模板,模板变量为指示器名称 {value}
textStyle: {
color: ‘#78849E‘
},
show: true
}
},
series: {
type: ‘radar‘,
tooltip: { // 提示框组件
trigger: ‘item‘,
formatter: function (params) {
// console.log(params.data)
var returnData = ‘‘
returnData += ‘睡眠:‘ + params.data.value[0] + ‘h/8h‘ + ‘<br/>‘ + ‘训练:‘ + params.data.value[1] + ‘h/6h‘ + ‘<br/>‘ + ‘累计步数:‘ + params.data.value[2] + ‘步/10000步‘ + ‘<br/>‘ + ‘运动量:‘ + params.data.value[3] + ‘kcal/800kcal‘ + ‘<br/>‘ + ‘站立:‘ + params.data.value[4] + ‘h/12h‘ + ‘<br/>‘
return returnData
}
},
itemStyle: {
normal: {
color: ‘#FF6B27‘
}
},
areaStyle: {
normal: {
opacity: 0.63
}
},
data: radarData
}
}
return options
// window.addEventListener(‘resize‘, totalRadar.resize)
}
/* 累计步数柱状图 */
export const stepNum = (xaxis, data) => {
// var totalStep = myEcharts.init(document.getElementById(id))
console.log(‘@utils !stepNumData‘, !stepNumData)
console.log(‘@utils stepNumData‘, stepNumData)
if (!stepNumData) {
for (let i = 0; i < 23; i++) {
stepNumData.push([i, 0])
}
}
var stepNumOption = {
backgroundColor: ‘#474751‘,
tooltip: {
trigger: ‘axis‘,
axisPointer: { // 坐标轴指示器,坐标轴触发有效
type: ‘shadow‘ // 默认为直线,可选为:‘line‘ | ‘shadow‘
}
},
grid: {
height: ‘90%‘,
width: ‘95%‘,
containLabel: true,
bottom: 0,
left: ‘1%‘/* "单位px" */
},
xAxis: xaxis,
yAxis: {
axisLabel: {
textStyle: {
color: ‘#78849E‘
},
formatter: ‘{value}‘
},
axisLine: {
show: false,
lineStyle: {
color: ‘#707070‘
}
},
splitLine: {
lineStyle: {
color: ‘#707070‘
}
},
nameTextStyle: {
fontSize: 2
}
},
series: [{
name: ‘步数‘,
type: ‘bar‘,
data: data,
itemStyle: {
normal: {
color: ‘#ED7741‘,
barBorderRadius: [2, 2, 2, 2]
}
}
}
]
}
if (JSON.stringify(stepNumData) === JSON.stringify([
[0, 0],
[1, 0],
[2, 0],
[3, 0],
[4, 0],
[5, 0],
[6, 0],
[7, 0],
[8, 0],
[9, 0],
[10, 0],
[11, 0],
[12, 0],
[13, 0],
[14, 0],
[15, 0],
[16, 0],
[17, 0],
[18, 0],
[19, 0],
[20, 0],
[21, 0],
[22, 0],
[23, 0]
])) {
stepNumOption.yAxis.max = 1000
stepNumOption.yAxis.min = 0
}
console.log(‘@utils stepNumOption‘, stepNumOption)
return stepNumOption
// totalStep.setOption(stepNumOption)
// window.addEventListener(‘resize‘, totalStep.resize)
}
/* 训练时间柱状图 */
export const myTrainTime = (id) => {
if (document.getElementById(id) == null) {
} else {
var totalTrain = myEcharts.init(document.getElementById(id))
var trainTimeOption = {
backgroundColor: ‘#474751‘,
tooltip: {
trigger: ‘axis‘,
axisPointer: { // 坐标轴指示器,坐标轴触发有效
type: ‘shadow‘ // 默认为直线,可选为:‘line‘ | ‘shadow‘
}
},
grid: {
height: ‘90%‘,
width: ‘95%‘,
containLabel: true,
bottom: 0,
left: ‘1%‘/* "单位px" */
},
xAxis: xAxis,
yAxis: {
max: 60,
min: 0,
axisLabel: {
textStyle: {
color: ‘#78849E‘
},
formatter: ‘{value}分钟‘
},
axisLine: {
show: false,
lineStyle: {
color: ‘#707070‘
}
},
splitLine: {
lineStyle: {
color: ‘#707070‘
}
},
nameTextStyle: {
fontSize: 5
}
},
series: [{
name: ‘训练时间‘,
type: ‘bar‘,
data: trainTimeData,
itemStyle: {
normal: {
color: ‘#ED7741‘,
barBorderRadius: [2, 2, 2, 2]
}
}
}]
}
totalTrain.setOption(trainTimeOption)
window.addEventListener(‘resize‘, totalTrain.resize)
}
}
/* 睡觉时间柱状图 */
export const mySleepTime = (id) => {
const categories = [‘‘]
function renderItem (params, api) {
const categoryIndex = 0
const start = api.coord([api.value(0), categoryIndex])
const end = api.coord([api.value(1), categoryIndex])
const height = api.size([0, 1])[1] * 0.4
const rectShape = myEcharts.graphic.clipRectByRect({
x: start[0],
y: start[1] - height / 2,
width: end[0] - start[0],
height: height
}, {
x: params.coordSys.x,
y: params.coordSys.y,
width: params.coordSys.width,
height: params.coordSys.height
})
return rectShape && {
type: ‘rect‘,
shape: rectShape,
style: api.style()
}
}
if (document.getElementById(id) == null) {
} else {
const totalSleep = myEcharts.init(document.getElementById(id))
const sleepTimeOption = {
tooltip: {
formatter: function (params) {
return params.marker + params.name + ‘: ‘ + params.value[2] + ‘ 分钟<br />开始时间: ‘ +
new Date(params.value[0]).toLocaleDateString() + ‘ ‘ + new Date(params.value[0]).toTimeString().split(‘ ‘)[0] +
‘<br />结束时间: ‘ + new Date(params.value[1]).toLocaleDateString() + ‘ ‘ + new Date(params.value[1]).toTimeString().split(‘ ‘)[0]
},
confine: true
},
grid: {
height: ‘100%‘,
width: ‘90%‘,
containLabel: true,
bottom: 0,
left: ‘4%‘
},
xAxis: {
type: ‘time‘,
scale: true,
splitLine: {
show: false
},
axisLine: {
lineStyle: {
color: ‘#707070‘
}
},
axisTick: {
show: false,
lineStyle: {
width: 0
}
}
},
yAxis: {
name: ‘睡眠‘,
data: categories,
axisLine: {
lineStyle: {
color: ‘#707070‘
}
},
splitLine: {
lineStyle: {
color: ‘#707070‘
}
},
nameGap: 5,
nameRotate: 90,
nameLocation: ‘middle‘
},
series: [{
type: ‘custom‘,
renderItem: renderItem,
itemStyle: {
normal: {
opacity: 1
}
},
encode: {
x: [0, 1]
},
data: sleepTimeData
}]
}
totalSleep.setOption(sleepTimeOption)
window.addEventListener(‘resize‘, totalSleep.resize)
}
/* if (document.getElementById(id) == null) {
} else {
var totalSleep = myEcharts.init(document.getElementById(id));
var sleepTimeOption = {
backgroundColor: ‘#474751‘,
tooltip: {
trigger: ‘axis‘,
axisPointer: { // 坐标轴指示器,坐标轴触发有效
type: ‘shadow‘ // 默认为直线,可选为:‘line‘ | ‘shadow‘
}
},
grid: {
height: ‘90%‘,
width: ‘95%‘,
containLabel: true,
bottom: 0,
left: ‘1%‘/!*"单位px"*!/
},
xAxis: xAxis,
yAxis: {
max: 60,
min: 0,
axisLabel: {
textStyle: {
color: ‘#78849E‘
},
formatter: ‘{value}分钟‘
},
axisLine: {
show: false,
lineStyle: {
color: ‘#707070‘
}
},
splitLine: {
lineStyle: {
color: ‘#707070‘
}
}
},
series: [{
name: ‘睡眠时间‘,
type: ‘bar‘,
data: sleepTimeData,
itemStyle: {
normal: {
color: ‘#ED7741‘,
barBorderRadius: [2, 2, 2, 2]
}
}
}]
};
totalSleep.setOption(sleepTimeOption);
window.addEventListener("resize", totalSleep.resize);
} */
}
/* 活动消耗柱状图 */
export const myActivityConsumption = (id) => {
if (document.getElementById(id) == null) {
} else {
var totalActivity = myEcharts.init(document.getElementById(id))
var activityConsumptionOption = {
backgroundColor: ‘#474751‘,
tooltip: {
trigger: ‘axis‘,
axisPointer: { // 坐标轴指示器,坐标轴触发有效
type: ‘shadow‘ // 默认为直线,可选为:‘line‘ | ‘shadow‘
}
},
grid: {
height: ‘90%‘,
width: ‘95%‘,
containLabel: true,
bottom: 0,
left: ‘1%‘/* "单位px" */
},
xAxis: xAxis,
yAxis: {
axisLabel: {
textStyle: {
color: ‘#78849E‘
},
formatter: ‘{value}cal‘
},
axisLine: {
show: false,
lineStyle: {
color: ‘#707070‘
}
},
splitLine: {
lineStyle: {
color: ‘#707070‘
}
}
},
series: [{
name: ‘活动消耗‘,
type: ‘bar‘,
data: activityConsumptionData,
itemStyle: {
normal: {
color: ‘#ED7741‘,
barBorderRadius: [2, 2, 2, 2]
}
}
}]
}
if (JSON.stringify(activityConsumptionData) === JSON.stringify([
[0, 0],
[1, 0],
[2, 0],
[3, 0],
[4, 0],
[5, 0],
[6, 0],
[7, 0],
[8, 0],
[9, 0],
[10, 0],
[11, 0],
[12, 0],
[13, 0],
[14, 0],
[15, 0],
[16, 0],
[17, 0],
[18, 0],
[19, 0],
[20, 0],
[21, 0],
[22, 0],
[23, 0]
])) {
activityConsumptionOption.yAxis.max = 100
activityConsumptionOption.yAxis.min = 0
}
totalActivity.setOption(activityConsumptionOption)
window.addEventListener(‘resize‘, totalActivity.resize)
}
}
/* 站立时间柱状图 */
export const myStandTime = (id) => {
if (document.getElementById(id) == null) {
} else {
var totalStand = myEcharts.init(document.getElementById(id))
var standTimeOption = {
backgroundColor: ‘#474751‘,
tooltip: {
trigger: ‘axis‘,
axisPointer: { // 坐标轴指示器,坐标轴触发有效
type: ‘shadow‘ // 默认为直线,可选为:‘line‘ | ‘shadow‘
}
},
grid: {
height: ‘90%‘,
width: ‘95%‘,
containLabel: true,
bottom: 0,
left: ‘1%‘/* "单位px" */
},
xAxis: xAxis,
yAxis: {
max: 60,
min: 0,
axisLabel: {
textStyle: {
color: ‘#78849E‘
},
formatter: ‘{value}分钟‘
},
axisLine: {
show: false,
lineStyle: {
color: ‘#707070‘
}
},
splitLine: {
lineStyle: {
color: ‘#707070‘
}
}
},
series: [{
name: ‘站立时间‘,
type: ‘bar‘,
data: standTimeData,
itemStyle: {
normal: {
color: ‘#ED7741‘,
barBorderRadius: [2, 2, 2, 2]
}
}
}]
}
totalStand.setOption(standTimeOption)
window.addEventListener(‘resize‘, totalStand.resize)
}
}
/* 距离柱状图 */
export const myDistance = (id) => {
if (document.getElementById(id) == null) {
} else {
var totalDistance = myEcharts.init(document.getElementById(id))
var distanceOption = {
backgroundColor: ‘#474751‘,
tooltip: {
trigger: ‘axis‘,
axisPointer: { // 坐标轴指示器,坐标轴触发有效
type: ‘shadow‘ // 默认为直线,可选为:‘line‘ | ‘shadow‘
}
},
grid: {
height: ‘90%‘,
width: ‘95%‘,
containLabel: true,
bottom: 0,
left: ‘1%‘/* "单位px" */
},
xAxis: xAxis,
yAxis: {
axisLabel: {
textStyle: {
color: ‘#78849E‘
},
formatter: ‘{value}米‘
},
axisLine: {
show: false,
lineStyle: {
color: ‘#707070‘
}
},
splitLine: {
lineStyle: {
color: ‘#707070‘
}
}
},
series: [{
name: ‘距离‘,
type: ‘bar‘,
data: distanceData,
itemStyle: {
normal: {
color: ‘#ED7741‘,
barBorderRadius: [2, 2, 2, 2]
}
}
}]
}
if (JSON.stringify(distanceData) === JSON.stringify([
[0, 0],
[1, 0],
[2, 0],
[3, 0],
[4, 0],
[5, 0],
[6, 0],
[7, 0],
[8, 0],
[9, 0],
[10, 0],
[11, 0],
[12, 0],
[13, 0],
[14, 0],
[15, 0],
[16, 0],
[17, 0],
[18, 0],
[19, 0],
[20, 0],
[21, 0],
[22, 0],
[23, 0]
])) {
distanceOption.yAxis.max = 1000
distanceOption.yAxis.min = 0
}
totalDistance.setOption(distanceOption)
window.addEventListener(‘resize‘, totalDistance.resize)
}
}
/* 爬高 */
export const myClimb = (id) => {
if (document.getElementById(id) == null) {
} else {
var totalClimb = myEcharts.init(document.getElementById(id))
var climbOption = {
backgroundColor: ‘#474751‘,
tooltip: {
trigger: ‘axis‘,
axisPointer: { // 坐标轴指示器,坐标轴触发有效
type: ‘shadow‘ // 默认为直线,可选为:‘line‘ | ‘shadow‘
}
},
grid: {
height: ‘90%‘,
width: ‘95%‘,
containLabel: true,
bottom: 0,
left: ‘1%‘/* "单位px" */
},
xAxis: xAxis,
yAxis: {
axisLabel: {
textStyle: {
color: ‘#78849E‘
},
formatter: ‘{value}米‘
},
axisLine: {
show: false,
lineStyle: {
color: ‘#707070‘
}
},
splitLine: {
lineStyle: {
color: ‘#707070‘
}
}
},
series: [{
name: ‘爬高‘,
type: ‘bar‘,
data: climbData,
itemStyle: {
normal: {
color: ‘#ED7741‘,
barBorderRadius: [2, 2, 2, 2]
}
}
}]
}
if (JSON.stringify(climbData) === JSON.stringify([
[0, 0],
[1, 0],
[2, 0],
[3, 0],
[4, 0],
[5, 0],
[6, 0],
[7, 0],
[8, 0],
[9, 0],
[10, 0],
[11, 0],
[12, 0],
[13, 0],
[14, 0],
[15, 0],
[16, 0],
[17, 0],
[18, 0],
[19, 0],
[20, 0],
[21, 0],
[22, 0],
[23, 0]
])) {
climbOption.yAxis.max = 10
climbOption.yAxis.min = 0
}
totalClimb.setOption(climbOption)
window.addEventListener(‘resize‘, totalClimb.resize)
}
}
export const padDate = (value) => {
return value < 10 ? ‘0‘ + value : value
}
自定义echart图形----悬浮提示框的显示数据---随意加单位后者其他修饰----不会影响数据
标签:items init data code clip render rom 详情 alac
原文地址:https://www.cnblogs.com/fdxjava/p/11898661.html