标签:marker figure tick imp 曲线 bsp label mat com
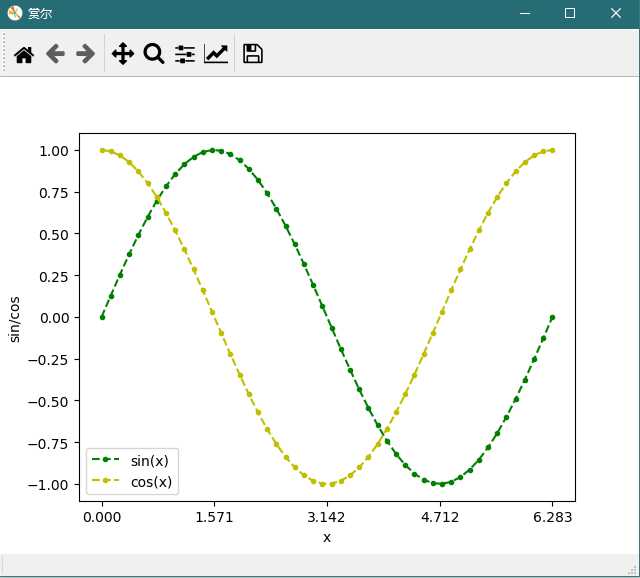
1、普通风格
代码
import numpy as np
import matplotlib.pyplot as plt

x = np.linspace(0, 2*np.pi, 50)
y1 = np.sin(x)
y2 = np.cos(x)
xticks=[0, np.pi/2, np.pi, 3*np.pi/2, 2*np.pi]

plt.figure(‘赏尔‘)

plt.plot(x, y1, c=‘g‘, marker=‘.‘, ls=‘--‘, label=‘sin(x)‘)
plt.plot(x, y2, ‘y.--‘, label=‘cos(x)‘)
plt.xlabel(‘x‘)
plt.ylabel(‘sin/cos‘)
plt.xticks(xticks,)
plt.legend()

plt.show()
图形
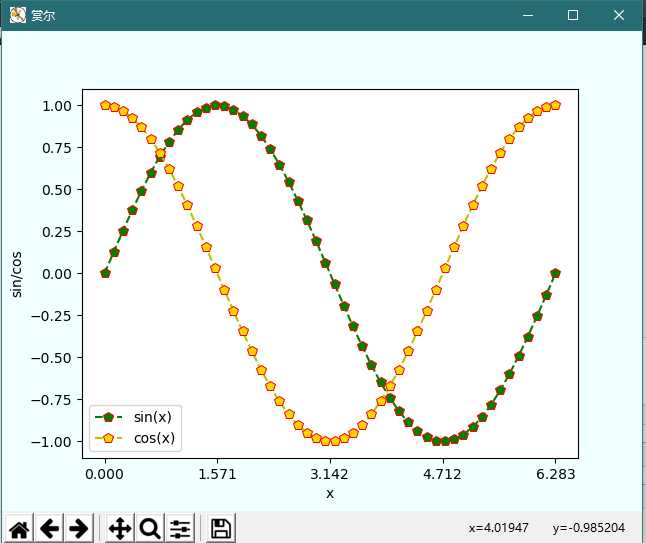
2、特别风格
代码
import numpy as np
import matplotlib.pyplot as plt

x = np.linspace(0, 2*np.pi, 50)
y1 = np.sin(x)
y2 = np.cos(x)
xticks=[0, np.pi/2, np.pi, 3*np.pi/2, 2*np.pi]

plt.figure(‘赏尔‘, facecolor=‘azure‘)

plt.plot(x, y1, c=‘g‘, marker=‘p‘, ls=‘--‘,
         mec=‘r‘, mfc=‘g‘, ms=7, mew=0.71,
         label=‘sin(x)‘)
plt.plot(x, y2, ‘yp--‘, mec=‘r‘, mfc=‘gold‘, ms=7, mew=0.72,
         label=‘cos(x)‘)
plt.xlabel(‘x‘)
plt.ylabel(‘sin/cos‘)
plt.xticks(xticks)
plt.legend()

plt.show()
图形
。。。
标签:marker figure tick imp 曲线 bsp label mat com
原文地址:https://www.cnblogs.com/shanger/p/11976118.html