标签:pdf orm 方法 nes legend taf 就会 交互 box
Matplotlib是一个强大的Python绘图和数据可视化的工具包。数据可视化也是我们数据分析的最重要的工作之一,可以帮助我们完成很多操作,例如:找出异常值、必要的一些数据转换等。完成数据分析的最终结果也许就是做一个可交互的数据可视化。
>: pip install matplotlib
import matplotlib.pyplot as plt
plt.rcParams[‘font.sans-serif‘] = [‘SimHei‘]
plt.rcParams[‘axes.unicode_minus‘] = False # 不打印警告信息
通用属性:
| 方法 | 描述 | |
|---|---|---|
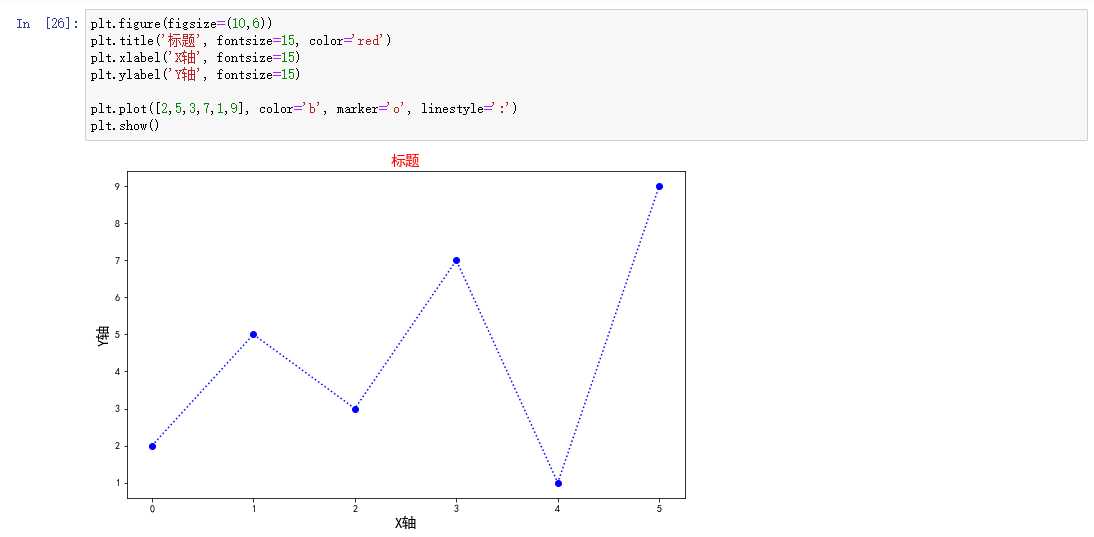
| plt.title() | 设置图像标题 | |
| plt.xlabel() | 设置x轴名称 | |
| plt.ylabel() | 设置y轴名称 | |
| plt.xlim() | 设置x轴范围 | |
| plt.ylim() | 设置y轴范围 | |
| plt.xticks() | 设置x轴刻度 | |
| plt.yticks() | 设置y轴刻度 | |
| plt.legend() | 设置曲线图例 |
| 函数 | 说明 | |
|---|---|---|
| plt.plot(x,y,fmt) | 坐标系 | |
| plt.boxplot(data,notch,position) | 箱型图 | |
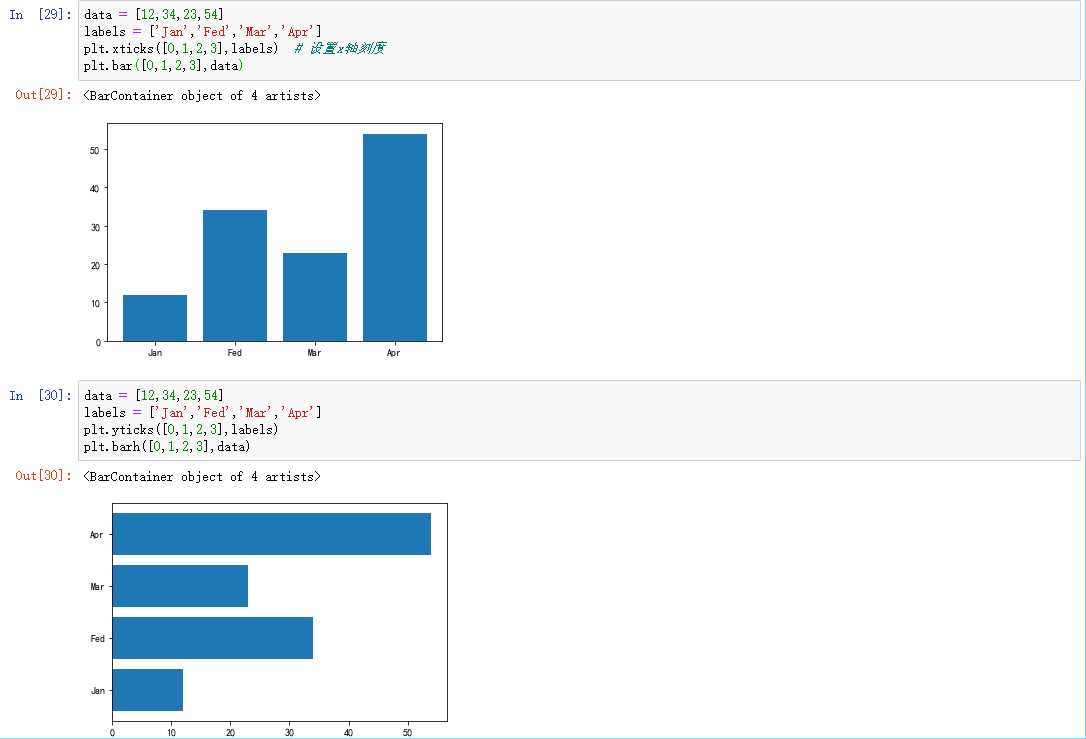
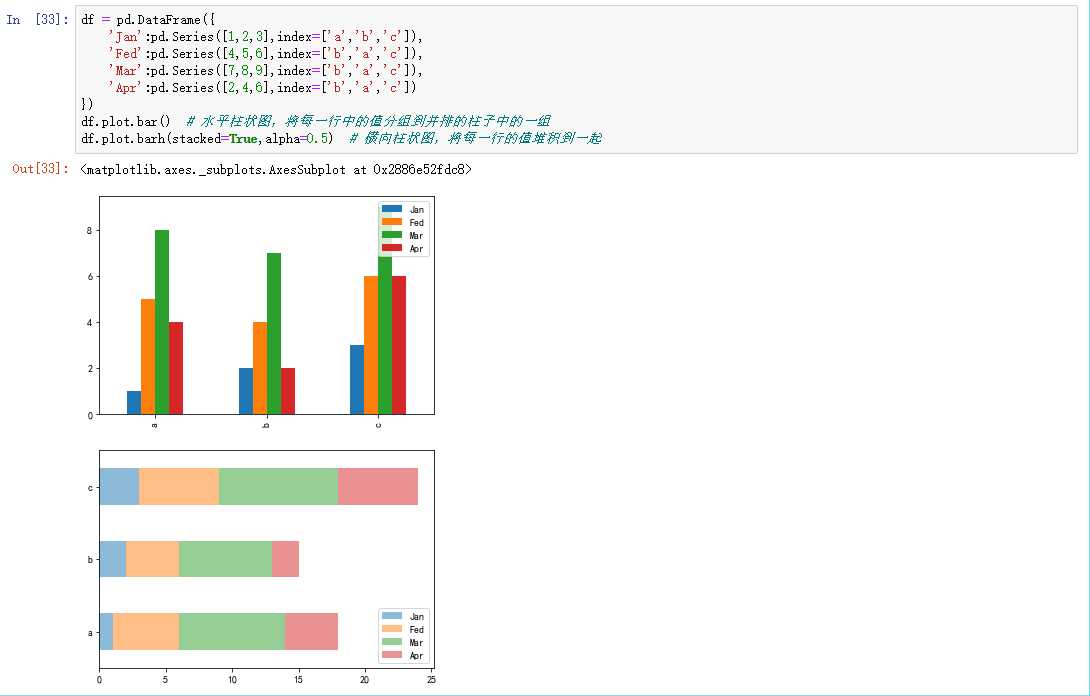
| plt.bar(left,height,width,bottom) | 柱状图 | |
| plt.barh(width,bottom,left,height) | 横向柱状图 | |
| plt.polar(theta,r) | 极坐标系 | |
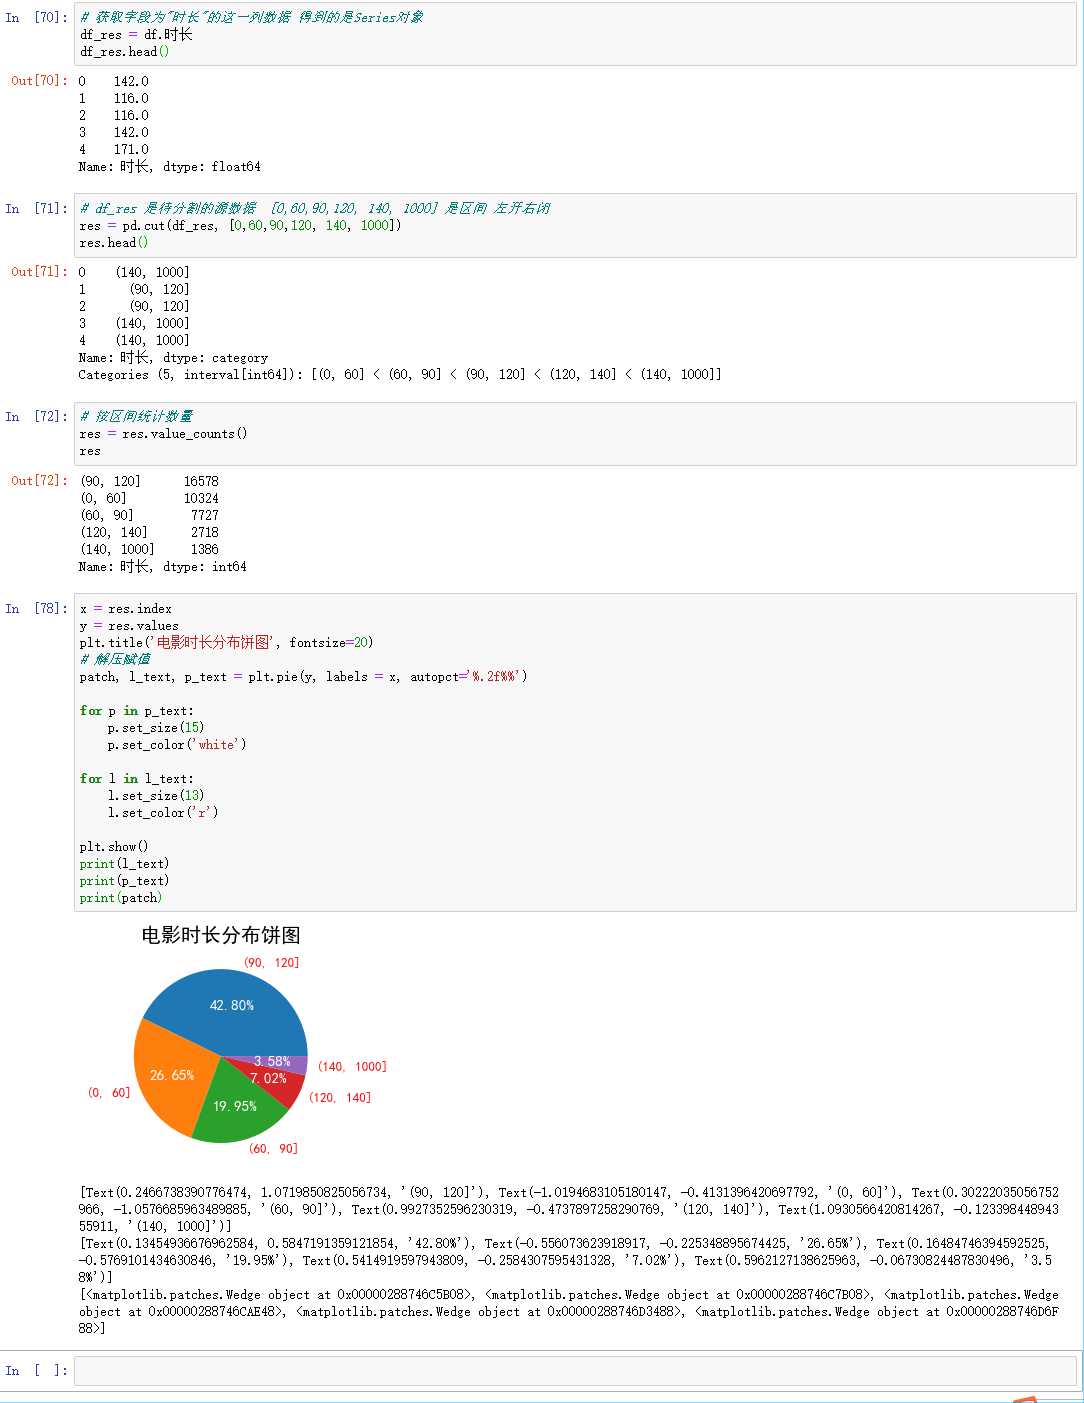
| plt.pie(data,explode) | 饼图 | |
| plt.psd(x,NFFT=256,pad_to,Fs) | 功率谱密度图 | |
| plt.specgram(x,NFFT=256,pad_to,F) | 谱图 | |
| plt.cohere(x,y,NFFT=256,Fs) | X-Y相关性函数 | |
| plt.scatter(x,y) | 散点图 | |
| plt.step(x,y,where) | 步阶图 | |
| plt.hist(x,bins,normed) | 直方图 |
注意: 默认Y轴是值
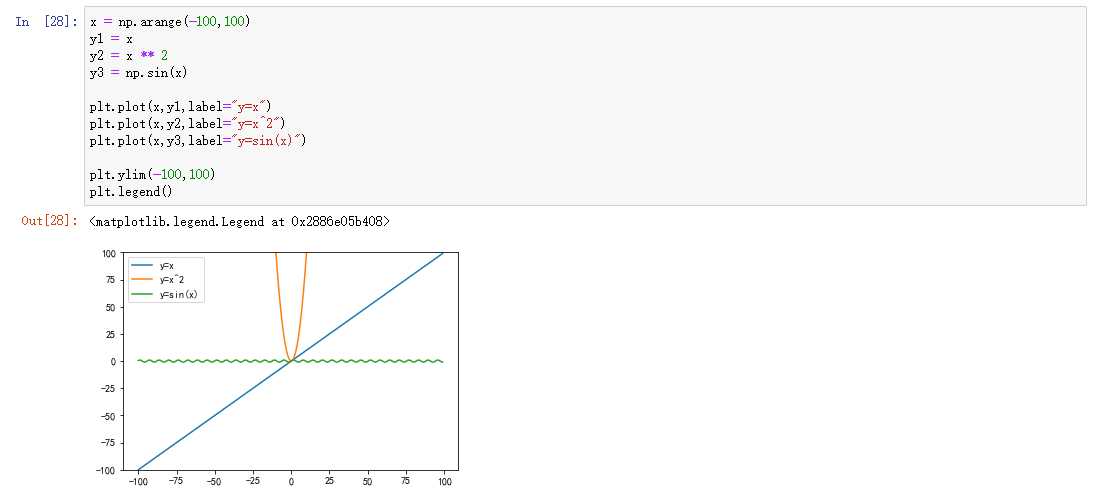
使用Matplotlib模块在一个窗口中绘制数学函数y=x, y=x**2,y=sinx的图像,使用不同颜色的线加以区别,并使用图例说明各个线代表什么函数。


plt.savafig(‘文件名.拓展名‘)
文件类型是通过文件扩展名推断出来的。因此,如果你使用的是.pdf,就会得到一个PDF文件。
plt.savefig(‘123.pdf‘)
savefig并非一定要写入磁盘,也可以写入任何文件型的对象,比如BytesIO:
from io import BytesIO
buffer = BytesIO()
plt.savefig(buffer)
plot_data = buffer.getvalue()
| 参数 | 说明 | |
|---|---|---|
| fname | 含有文件路径的字符串或者Python的文件型对象。 | |
| dpi | 图像分辨率,默认为100 | |
| format | 显示设置文件格式("png","jpg","pdf","svg","ps",...) | |
| facecolor、edgecolor | 背景色,默认为"W"(白色) | |
| bbox_inches | 图表需要保存的部分。设置为”tight“,则尝试剪除图表周围空白部分 |
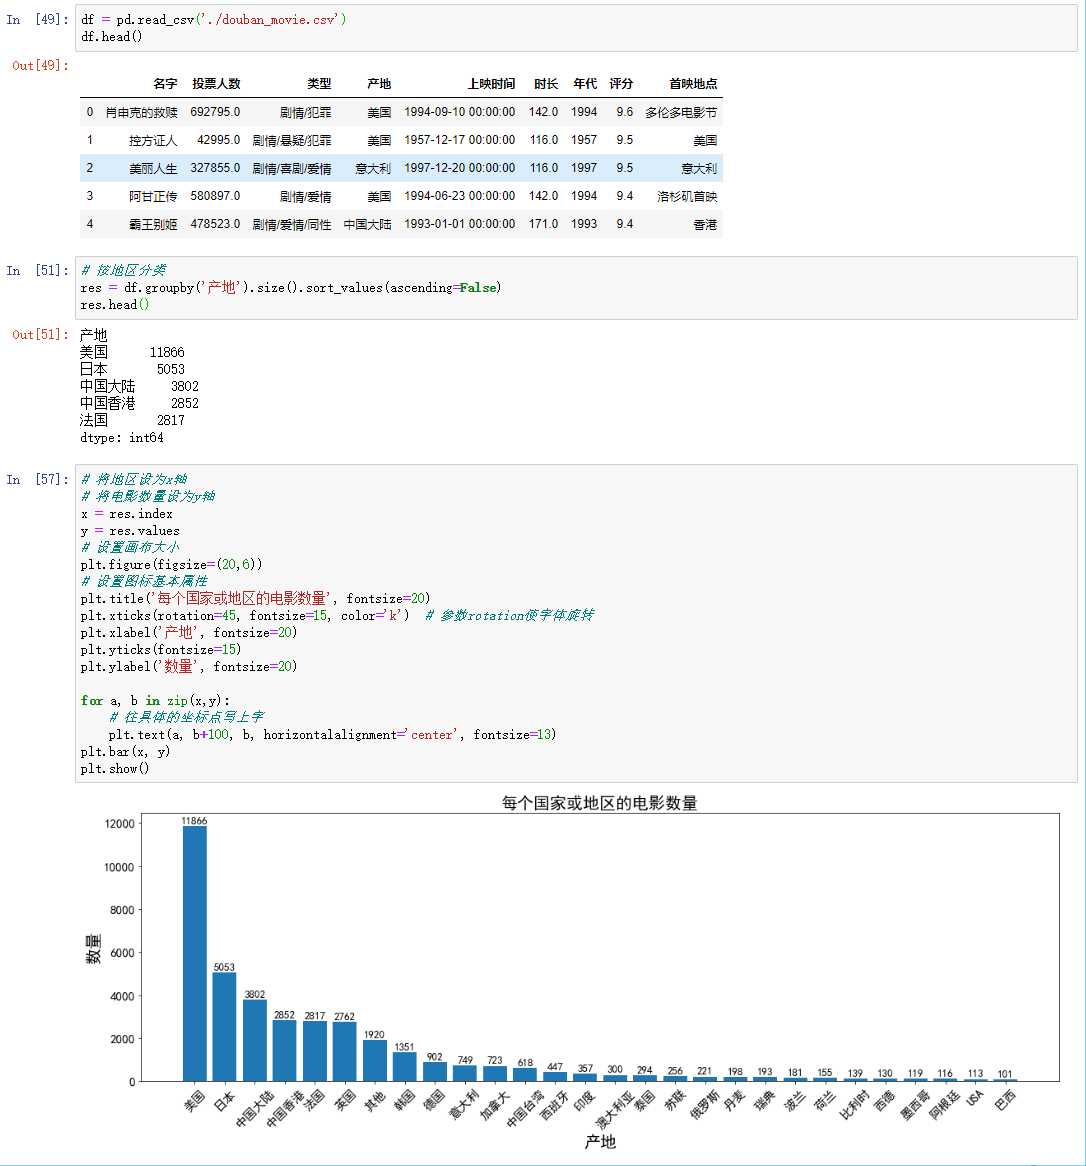
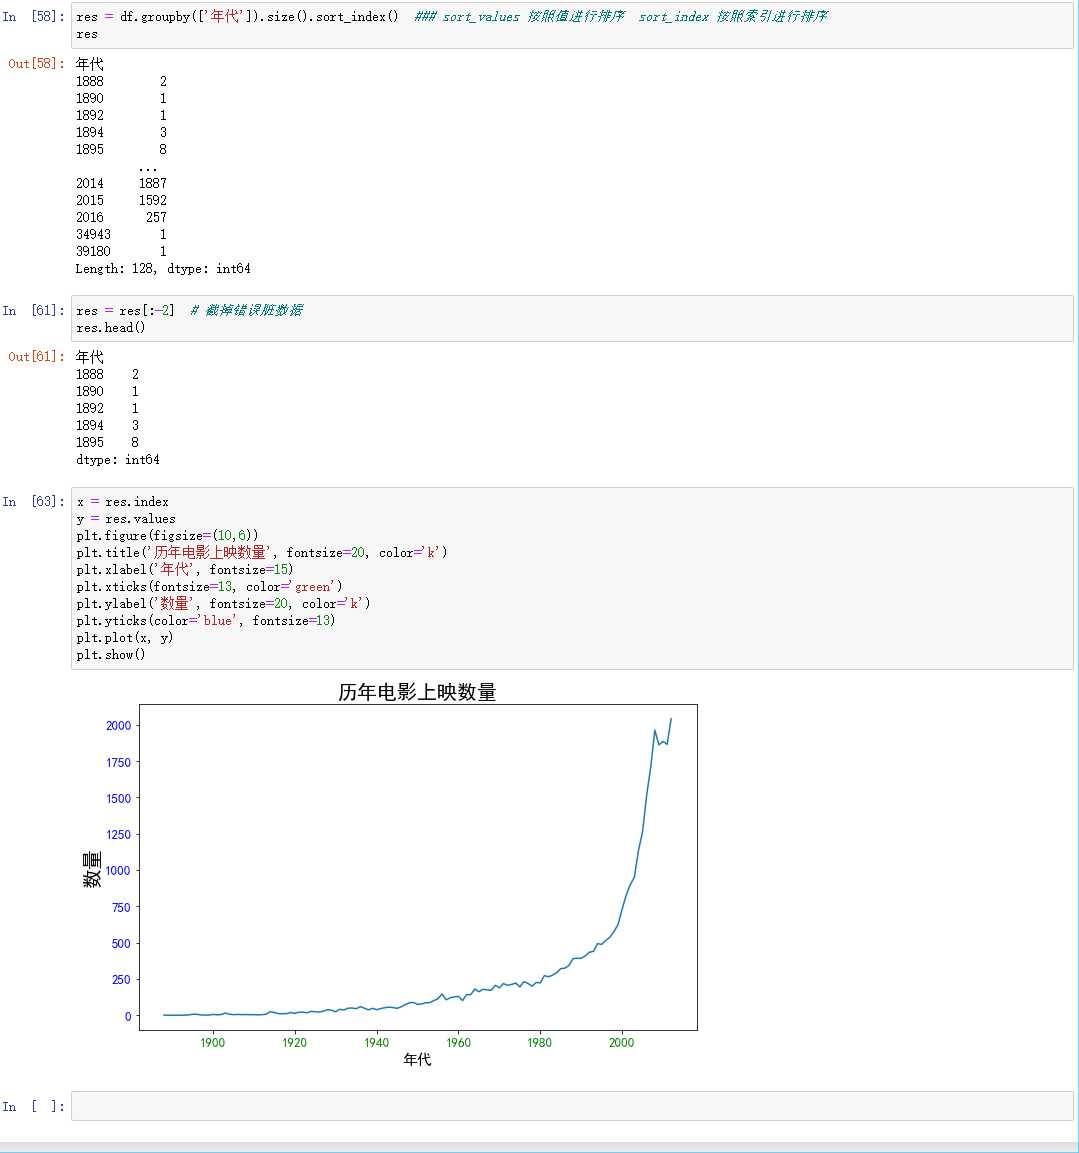
rotation 参数可以使字体旋转
plt.xticks(rotation=90, fontsize=15, color=‘red‘) # 使字体旋转90度
text 属性可以在指定坐标点写字
 plt.text(a, b+100, b, horizontalalignment=‘center‘, fontsize=13)
‘‘‘
a : 是x轴坐标
b : 是y轴坐标
horizontalalignment : 对齐方式
‘‘‘

标签:pdf orm 方法 nes legend taf 就会 交互 box
原文地址:https://www.cnblogs.com/waller/p/11984077.html