标签:des style blog http io color os ar 使用
做数据分析,首先是要熟悉和理解数据,所以掌握一个趁手的可视化工具是非常重要的,否则对数据连个基本的感性认识都没有,如何进行下一步的design
Getting Started with Matplotlib
先看个简单的例子,plot,即画线
画线,需要给出线上的点的坐标,然后Matplotlib会自动将点连成线
In [2]: x = range(6) In [3]: plt.plot(x, [xi**2 for xi in x])

可以看到plot的参数是两个list,分布表示x轴和y轴的坐标点的list
可以看到这里的线不是很平滑,是因为range的产生的点粒度比较粗,并且使用list comprehension来产生y值
所以这里尽量使用Numpy的arange(x, y, z)函数
好处是粒度可以更小,而且关键是返回的是Numpy的Array,可以直接进行向量或矩阵运算,如下
In [3]: x = np.arange(1, 5) In [4]: plt.plot(x, x*1.5, x, x*3.0, x, x/3.0)

可以用plot画多条线
Grid, axes, and labels
打开网格
In [5]: plt.grid(True)

默认会自动产生X和Y轴上的取值范围,比如上面的图,
In [5]: plt.axis() # shows the current axis limits values
Out[5]: (1.0, 4.0, 0.0, 12.0)
分别表示,[xmin, xmax, ymin, ymax],所以看上图x轴是从1到4,y轴是从0到12
改变取值范围, In [6]: plt.axis([0, 5, -1, 13]) # set new axes limits

还能给x和y轴加上lable说明,
In [2]: plt.plot([1, 3, 2, 4])
In [3]: plt.xlabel(‘This is the X axis‘)
In [4]: plt.ylabel(‘This is the Y axis‘)

Titles and legends
给整个图加上title
In [2]: plt.plot([1, 3, 2, 4]) In [3]: plt.title(‘Simple plot‘)

还可以给每条线增加图示,legend
In [3]: x = np.arange(1, 5)
In [4]: plt.plot(x, x*1.5, label=‘Normal‘)
In [5]: plt.plot(x, x*3.0, label=‘Fast‘)
In [6]: plt.plot(x, x/3.0, label=‘Slow‘)
In [7]: plt.legend()

指定每条线的label,然后调用legend()会自动显示图示
可以看到这个图示的位置不是很好,挡住图,可以通过参数指定位置
legend(loc=‘upper left‘)
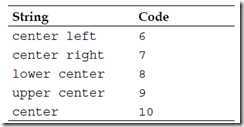
loc可以选取的值,其中best,是自动找到最好的位置


Saving plots to a file
最简单,使用默认设置 plt.savefig(‘plot123.png‘)
其中两个设置可以决定图片大小,figure size and the DPI
In [1]: import matplotlib as mpl
In [2]: mpl.rcParams[‘figure.figsize‘]
Out[2]: [8.0, 6.0]
In [3]: mpl.rcParams[‘savefig.dpi‘]
Out[3]: 100
an 8x6 inches figure with 100 DPI results in an 800x600 pixels image,这就是默认值
In [4]: plt.savefig(‘plot123_2.png‘, dpi=200)
这样图的分辨率,变为1600×1200
Decorate Graphs with Plot Styles
Markers and line styles
上面画的线都是一样的,其实我们可以画出各种不同的线 Marker就是指形成线的那些点
plot() supports an optional third argument that contains a format string for each pair of X, Y arguments in the form of: plt.plot(X, Y, ‘<format>‘, ...)
plot通过第三个string参数可以用来指定,Colors,Line styles,Marker styles
线的颜色,

线的style,

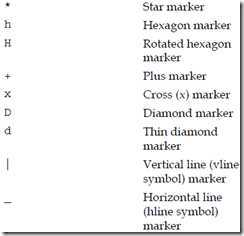
Marker的style


可以用string format单独或混合的表示所有的style,
In [3]: y = np.arange(1, 3, 0.3) In [4]: plt.plot(y, ‘cx--‘, y+1, ‘mo:‘, y+2, ‘kp-.‘);

比如第一条线,c表示cyan青色,x表示marker style为x,--表示line style
一般用string format已经足够,但也可以用具体的keyword参数进行更多的个性化

Handling X and Y ticks
前面X和Y轴上的ticks是自动生成的,这个也是可以通过xticks和yticks函数个性化定制的
The arguments (in the form of lists) that we can pass to the function are:
? Locations of the ticks
? Labels to draw at these locations (if necessary)
可以定义,每个tick的location和相应的label(可选,不指定默认显示location)
In [2]: x = [5, 3, 7, 2, 4, 1]
In [3]: plt.plot(x);
In [4]: plt.xticks(range(len(x)), [‘a‘, ‘b‘, ‘c‘, ‘d‘, ‘e‘, ‘f‘]);
In [5]: plt.yticks(range(1, 8, 2));

对x轴同时指定location和label 对y轴只是指定location
Plot types
上面介绍了很多,都是以plot作为例子,matplotlib还提供了很多其他类型的图 作者这张图很赞,描述所有图的用法

Histogram charts
直方图是用来离散的统计数据分布的,会把整个数据集,根据取值范围,分成若干类,称为bins 然后统计中每个bin中的数据个数
In [3]: y = np.random.randn(1000)
In [4]: plt.hist(y);
In [5]: plt.show()

hist默认是分为10类,即bins=10, 上图就是把取值[-4,4]上的1000个随机数,分成10个bins,统计每个的数据个数 可以看出这个随机函数是典型的正态分布
我们可以改变bins的值, In [6]: plt.hist(y, 25);

如图是,分成25个bins
Error bar charts
In [3]: x = np.arange(0, 4, 0.2)
In [4]: y = np.exp(-x)
In [5]: e1 = 0.1 * np.abs(np.random.randn(len(y)))
In [8]: e2 = 0.1 * np.abs(np.random.randn(len(y)))
In [9]: plt.errorbar(x, y, yerr=e1, xerr=e2, fmt=‘.-‘, capsize=0);

画出每个点的同时,画出每个点上的误差范围
还能画出非对称的误差, In [11]: plt.errorbar(x, y, yerr=[e1, e2], fmt=‘.-‘);

Bar charts
plt.bar([1, 2, 3], [3, 2, 5]);

对于bar,需要设定3个参数
左起始坐标,高度,宽度(可选,默认0.8)
所以上面的例子,指定起始点和高度参数
好,看个复杂的例子,bar图一般用于比较多个数据值
In [3]: data1 = 10*np.random.rand(5)
In [4]: data2 = 10*np.random.rand(5)
In [5]: data3 = 10*np.random.rand(5)
In [6]: e2 = 0.5 * np.abs(np.random.randn(len(data2)))
In [7]: locs = np.arange(1, len(data1)+1)
In [8]: width = 0.27
In [9]: plt.bar(locs, data1, width=width);
In [10]: plt.bar(locs+width, data2, yerr=e2, width=width, color=‘red‘);
In [11]: plt.bar(locs+2*width, data3, width=width, color=‘green‘) ;
In [12]: plt.xticks(locs + width*1.5, locs);

需要学习的是,如何指定多个bar的起始位置,后一个bar的loc = 前一个bar的loc + width 如何设置ticks的label,让它在一组bars的中间位置,locs + width*1.5
Pie charts
饼图很好理解,表示成分
In [2]: plt.figure(figsize=(3,3));
In [3]: x = [45, 35, 20]
In [4]: labels = [‘Cats‘, ‘Dogs‘, ‘Fishes‘]
In [5]: plt.pie(x, labels=labels);

来个复杂的,
增加explode,即突出某些wedges,可以设置explode来增加offset the wedge from the center of the pie, 即radius fraction
0表示不分离,越大表示离pie center越远,需要显式指定每个wedges的explode
增加autopct,即在wedges上显示出具体的比例
In [2]: plt.figure(figsize=(3,3));
In [3]: x = [4, 9, 21, 55, 30, 18]
In [4]: labels = [‘Swiss‘, ‘Austria‘, ‘Spain‘, ‘Italy‘, ‘France‘, ‘Benelux‘]
In [5]: explode = [0.2, 0.1, 0, 0, 0.1, 0]
In [6]: plt.pie(x, labels=labels, explode=explode, autopct=‘%1.1f%%‘);

Scatter plots
只画点,不连线,用来描述两个变量之间的关系,比如在进行数据拟合之前,看看变量间是线性还是非线性
In [3]: x = np.random.randn(1000)
In [4]: y = np.random.randn(1000)
In [5]: plt.scatter(x, y);

通过s来指定size,c来指定color, marker来指定点的形状

In [7]: size = 50*np.random.randn(1000)
In [8]: colors = np.random.rand(1000)
In [9]: plt.scatter(x, y, s=size, c=colors);

Text inside figure, annotations, and arrows
用于添加注解,
增加text很简单,坐标x,y,内容
plt.text(x, y, text)
例子,
In [3]: x = np.arange(0, 2*np.pi, .01)
In [4]: y = np.sin(x)
In [5]: plt.plot(x, y);
In [6]: plt.text(0.1, -0.04, ‘sin(0)=0‘);

annotate,便于增加注释
参数,
xy,需要添加注释的坐标
xytext,注释本身的坐标
arrowprops,箭头的类型和属性
In [2]: y = [13, 11, 13, 12, 13, 10, 30, 12, 11, 13, 12, 12, 12, 11,12]
In [3]: plt.plot(y);
In [4]: plt.ylim(ymax=35); 增大y的空间,否则注释放不下
In [5]: plt.annotate(‘this spot must really\nmean something‘,
xy=(6, 30), xytext=(8, 31.5), arrowprops=dict(facecolor=‘black‘, shrink=0.05));

明显这个箭头比较丑,箭头可以有很多种
In [2]: plt.axis([0, 10, 0, 20]);
In [3]: arrstyles = [‘-‘, ‘->‘, ‘-[‘, ‘<-‘, ‘<->‘, ‘fancy‘, ‘simple‘,‘wedge‘]
In [4]: for i, style in enumerate(arrstyles):
plt.annotate(style, xytext=(1, 2+2*i), xy=(4, 1+2*i), arrowprops=dict(arrowstyle=style));
In [5]: connstyles=["arc", "arc,angleA=10,armA=30,rad=15", "arc3,rad=.2", "arc3,rad=-.2", "angle", "angle3"]
In [6]: for i, style in enumerate(connstyles):
plt.annotate("", xytext=(6, 2+2*i), xy=(8, 1+2*i), arrowprops=dict(arrowstyle=‘->‘, connectionstyle=style));

Subplots
上面matplotlib,默认会帮我们创建figure和subplot
fig = plt.figure() ax = fig.add_subplot(111)
其实我们可以显式的创建,这样的好处是我们可以在一个figure中画多个subplot
其中subplot的参数,
fig.add_subplot(numrows, numcols, fignum)
- numrows represents the number of rows of subplots to prepare
- numcols represents the number of columns of subplots to prepare
- fignum varies from 1 to numrows*numcols and specifies the current subplot (the one used now)
我们会产生numrows×numcols个subplot,fignum表示编号
In [2]: fig = plt.figure()
In [3]: ax1 = fig.add_subplot(211)
In [4]: ax1.plot([1, 2, 3], [1, 2, 3]);
In [5]: ax2 = fig.add_subplot(212)
In [6]: ax2.plot([1, 2, 3], [3, 2, 1]);

Plotting dates
日期比较长,直接画在坐标轴上,没法看
具体看下如何画?
产生x轴数据,利用mpl.dates.drange产生x轴坐标
import matplotlib as mpl
In [7]: date2_1 = dt.datetime(2008, 9, 23)
In [8]: date2_2 = dt.datetime(2008, 10, 3)
In [9]: delta2 = dt.timedelta(days=1)
In [10]: dates2 = mpl.dates.drange(date2_1, date2_2, delta2)
随机产生y轴坐标,画出polt图
In [11]: y2 = np.random.rand(len(dates2)) In [12]: ax2.plot_date(dates2, y2, linestyle=‘-‘);
关键步骤来了,我们要设置xaxis的locator和formatter来显示时间 首先设置formatter,
In [13]: dateFmt = mpl.dates.DateFormatter(‘%Y-%m-%d‘) In [14]: ax2.xaxis.set_major_formatter(dateFmt)
再设置locator,
In [15]: daysLoc = mpl.dates.DayLocator()
In [16]: hoursLoc = mpl.dates.HourLocator(interval=6)
In [17]: ax2.xaxis.set_major_locator(daysLoc)
In [18]: ax2.xaxis.set_minor_locator(hoursLoc)
注意这里major和minor,major就是大的tick,minor是比较小的tick(默认是null)
比如date是大的tick,但是想看的细点,所以再设个hour的tick,但是画24个太多了,所以interval=6,只画4个
而formatter只是设置major的,所以minor的是没有label的

再看个例子,
产生x轴坐标,y轴坐标,画出plot
In [22]: date1_1 = dt.datetime(2008, 9, 23)
In [23]: date1_2 = dt.datetime(2009, 2, 16)
In [24]: delta1 = dt.timedelta(days=10)
In [25]: dates1 = mpl.dates.drange(date1_1, date1_2, delta1)
In [26]: y1 = np.random.rand(len(dates1))
In [27]: ax1.plot_date(dates1, y1, linestyle=‘-‘);
设置locator major的是Month,minor的是week
In [28]: monthsLoc = mpl.dates.MonthLocator()
In [29]: weeksLoc = mpl.dates.WeekdayLocator()
In [30]: ax1.xaxis.set_major_locator(monthsLoc)
In [31]: ax1.xaxis.set_minor_locator(weeksLoc)
设置Formatter
In [32]: monthsFmt = mpl.dates.DateFormatter(‘%b‘) In [33]: ax1.xaxis.set_major_formatter(monthsFmt)

Using LaTeX formatting
这个略diao
the start and the end of a mathtext string is $ 在python raw string需要r‘’,表示不转义
直接看例子,
In [6]: ax.text(2, 8, r"$ \mu \alpha \tau \pi \lambda \omega \tau \lambda \iota \beta $");
In [7]: ax.text(2, 6, r"$ \lim_{x \rightarrow 0} \frac{1}{x} $");
In [8]: ax.text(2, 4, r"$ a \ \leq \ b \ \leq \ c \ \Rightarrow \ a \ \leq \ c$");
In [9]: ax.text(2, 2, r"$ \sum_{i=1}^{\infty}\ x_i^2$");
In [10]: ax.text(4, 8, r"$ \sin(0) = \cos(\frac{\pi}{2})$");
In [11]: ax.text(4, 6, r"$ \sqrt[3]{x} = \sqrt{y}$");
In [12]: ax.text(4, 4, r"$ \neg (a \wedge b) \Leftrightarrow \neg a \vee \neg b$");
In [13]: ax.text(4, 2, r"$ \int_a^b f(x)dx$");

标签:des style blog http io color os ar 使用
原文地址:http://blog.csdn.net/yapian8/article/details/40626693