标签:个数 rand rman lod gen plt save image top
目录
绘制单条线形图
import matplotlib.pyplot as plt
import numpy as np
x = [1,2,3,4,5]
y = [5,4,3,2,1]
plt.plot(x,y)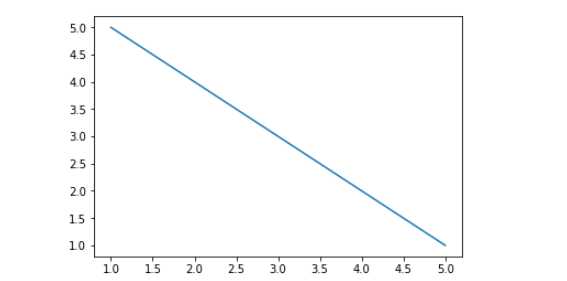
绘制抛物线形图
x = np.linspace(-np.pi,np.pi,40)
y = x**2
plt.plot(x,y)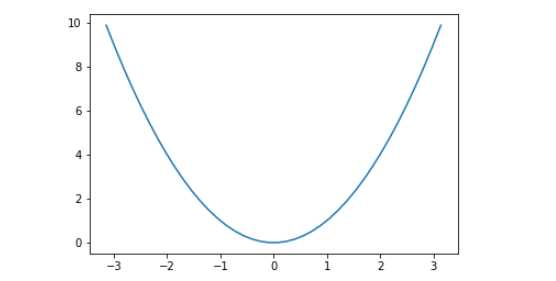
在一个坐标系中绘制多条曲线
plt.plot(x,y)
plt.plot(x-1,y+2)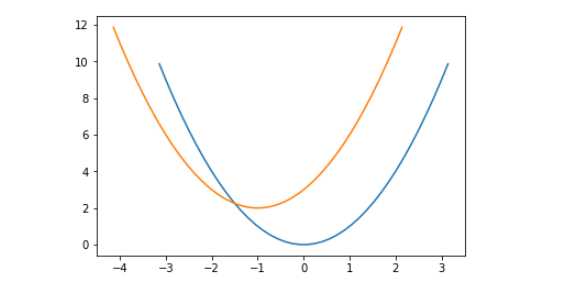
给x,y设定标识
plt.plot(x,y)
plt.xlabel('name')
plt.ylabel('score')
plt.title('Performance trends')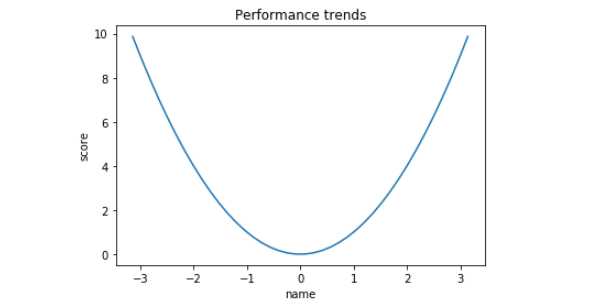
设置图例大小
plt.figure(figsize=(10,10))
plt.plot(x,y)
设置图例legend()
plt.plot(x,y,label='s1')
plt.plot(x-1,y+2,label='s2')
plt.legend(loc=4)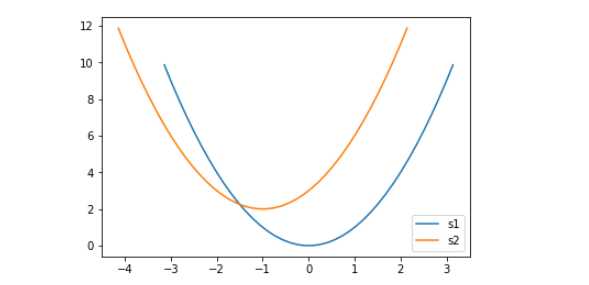
保存图例
# 1.实例化一个对象
fig = plt.figure()

# 2.画图
plt.plot(x,y,label='hello')
plt.plot(x-1,y+2,label='hey')
plt.legend(loc=4)

# .保存
fig.savefig('./123.png')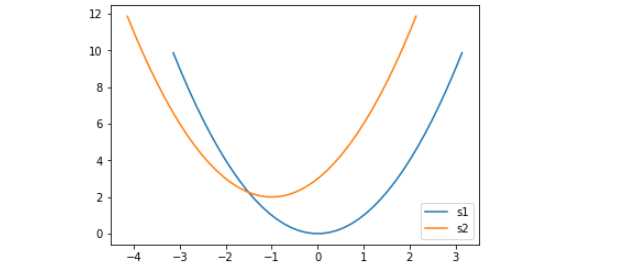
plt.bar()参数:第一个参数是索引。第二个参数是数据值。第三个参数是条形的宽度
示例:
x = [1,2,3,4,5]   # x轴的刻度
y = [2,3,4,5,6]   # 柱子的高度
plt.bar(x,y)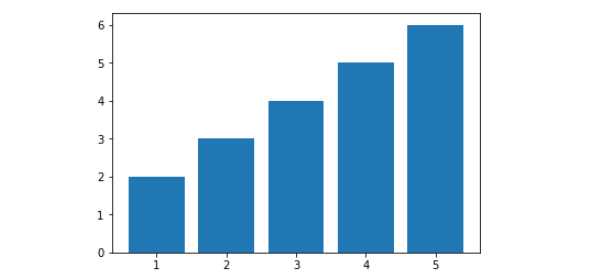
是一个特殊的柱状图,又叫做密度图
plt.hist()的参数:
示例:
x = [1,1,2,3,4,5,5,5,6,7,7,7,7,7,7,8]
plt.hist(x,bins=15)   # 柱子的个数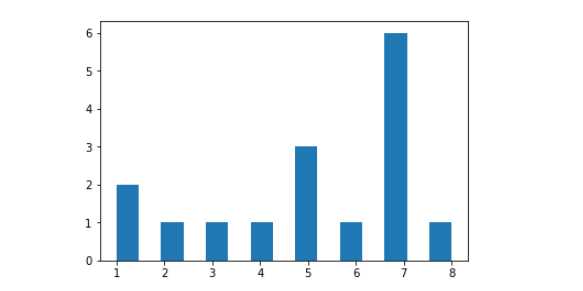
饼图适合展示各部分占总体的比例,条形图适合比较各部分的大小
pie()只有一个参数x
示例:
示例一
arr=[11,22,31,15]
plt.pie(arr)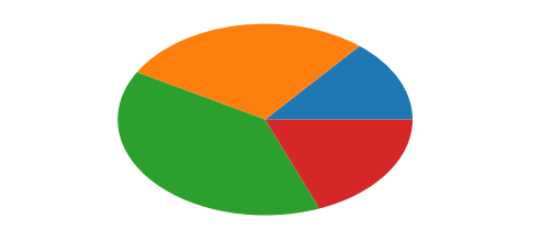
示例二:加起来不满足1
arr=[0.2,0.3,0.1]
plt.pie(arr)
示例三:设置各部分的标识
arr=[11,22,31,15]
plt.pie(arr,labels=['a','b','c','d'])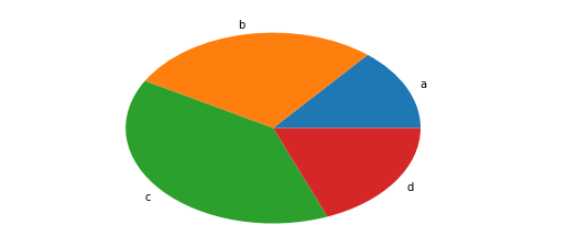
示例四:设置标识距离中心的距离
arr=[11,22,31,15]
plt.pie(arr,labels=['a','b','c','d'],labeldistance=0.3)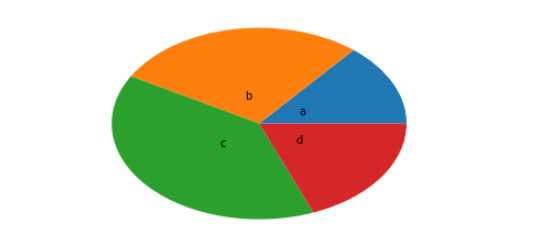
示例五:显示各部分所占的比例
arr=[11,22,31,15]
plt.pie(arr,labels=['a','b','c','d'],labeldistance=0.3,autopct='%.6f%%')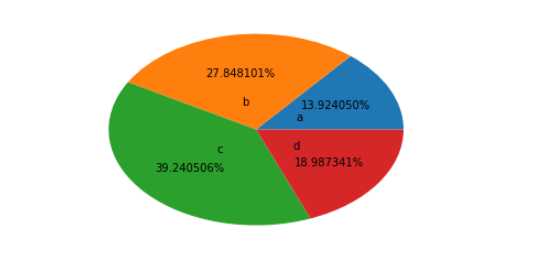
示例六:各部分设置距离中心点不同的距离
arr=[11,22,31,15]
plt.pie(arr,labels=['a','b','c','d'],labeldistance=0.3,shadow=True,explode=[0.2,0.3,0.2,0.4])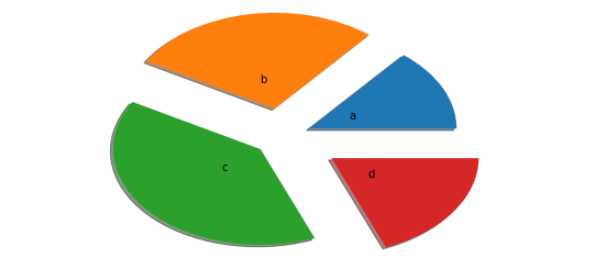
因变量随自变量而变化的大致趋势
示例:
示例一:有规律散点图
x = np.array([1,3,5,7,9])
y = x ** 2
plt.scatter(x,y)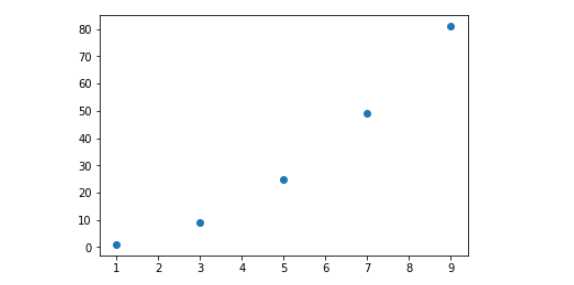
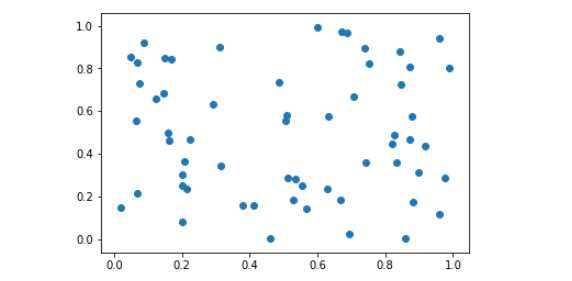
示例二:无规律散点图
x = np.random.random((60,))
y = np.random.random((60,))
plt.scatter(x,y)
标签:个数 rand rman lod gen plt save image top
原文地址:https://www.cnblogs.com/liubing8/p/12038441.html