标签:app elk etc 过滤 health 搭建 enforce store 一个
ELK 官网:
https://www.elastic.co/cn/what-is/elk-stack
前提:关闭防火墙,关闭selinux
systemctl stop firewalld
setenforce 0
系统优化:
|
1
2
3
4
5
|
[root@node1 ~]# cat /etc/security/limits.conf |tail -n 15* soft nproc 65535* soft nofile 65535* hard nproc 65535* hard nofile 65535 |
vm.max_map_coun=655360
三个组件都安装到一台服务器上
129:ES+kibana
131:logstash
1 安装jdk
rpm -ivh jdk-8u131-linux-x64_.rpm
2 配置elasticsearch 的yum源
|
1
2
3
4
5
6
7
8
9
|
[root@node1 ~]# cat /etc/yum.repos.d/elasticsearch.repo[elasticsearch-6.x]name=Elasticsearch repository for 6.x packagesbaseurl=https://artifacts.elastic.co/packages/6.x/yumgpgcheck=1gpgkey=https://artifacts.elastic.co/GPG-KEY-elasticsearchenabled=1autorefresh=1type=rpm-md |
yum install elasticsearch
配置开机自启动
[root@node1 ~]# systemctl enable elasticsearch.service
开启服务
[root@node1 ~]# systemctl start elasticsearch.service
验证服务是否启动
|
1
2
3
4
5
|
[root@localhost elasticsearch]# netstat -lptnu|grep javatcp6 0 0 127.0.0.1:9200 :::* LISTEN 51790/java tcp6 0 0 ::1:9200 :::* LISTEN 51790/java tcp6 0 0 127.0.0.1:9300 :::* LISTEN 51790/java tcp6 0 0 ::1:9300 :::* LISTEN 51790/java |
监听端口:
9200作为Http协议,主要用于外部通讯
9300作为Tcp协议,ES集群之间是通过9300进行通讯
配置文件路径:
|
1
2
3
4
5
6
7
8
9
10
|
[root@localhost elasticsearch]# ll /etc/elasticsearch/total 36-rw-rw----. 1 root elasticsearch 199 Nov 7 01:56 elasticsearch.keystore-rw-rw----. 1 root elasticsearch 2869 Oct 15 23:31 elasticsearch.yml-rw-rw----. 1 root elasticsearch 3685 Oct 15 23:31 jvm.options-rw-rw----. 1 root elasticsearch 13085 Oct 15 23:31 log4j2.properties-rw-rw----. 1 root elasticsearch 473 Oct 15 23:31 role_mapping.yml-rw-rw----. 1 root elasticsearch 197 Oct 15 23:31 roles.yml-rw-rw----. 1 root elasticsearch 0 Oct 15 23:31 users-rw-rw----. 1 root elasticsearch 0 Oct 15 23:31 users_roles |
|
1
2
3
4
5
|
[root@huazai007 ~]# cat /etc/elasticsearch/elasticsearch.yml |grep -v ‘^#‘path.data: /var/lib/elasticsearchpath.logs: /var/log/elasticsearchnetwork.host: 172.18.47.110http.port: 9200 |
日志文件路径:
|
1
2
3
4
5
6
7
8
9
10
11
|
[root@localhost elasticsearch]# pwd/var/log/elasticsearch[root@localhost elasticsearch]# lltotal 48-rw-r--r--. 1 elasticsearch elasticsearch 0 Nov 7 01:58 elasticsearch_access.log-rw-r--r--. 1 elasticsearch elasticsearch 0 Nov 7 01:58 elasticsearch_audit.log-rw-r--r--. 1 elasticsearch elasticsearch 0 Nov 7 01:58 elasticsearch_deprecation.log-rw-r--r--. 1 elasticsearch elasticsearch 0 Nov 7 01:58 elasticsearch_index_indexing_slowlog.log-rw-r--r--. 1 elasticsearch elasticsearch 0 Nov 7 01:58 elasticsearch_index_search_slowlog.log-rw-r--r--. 1 elasticsearch elasticsearch 8502 Nov 7 01:58 elasticsearch.log-rw-r--r--. 1 elasticsearch elasticsearch 35454 Nov 7 02:00 gc.log.0.current |
常用命令:
验证服务
curl -X GET http://127.0.0.1:9200
elasticsearch 查看集群统计信息
curl -XGET ‘http://localhost:9200/_cluster/stats?pretty‘
查看集群状态
curl -X GET ‘localhost:9200/_cat/health?v‘
创建索引:test_index
curl -X PUT HTTP://localhost:9200/test_index?pretty
elasticsearch 查看所有索引
curl -X GET HTTP://localhost:9200/_cat/indices?v
删除索引:test_index
curl -XDELETE ‘localhost:9200/test_index?pretty‘
3 logstash 安装
配置logstash yum 源
|
1
2
3
4
5
6
7
8
|
[logstash-6.x]name=Elastic repository for 6.x packagesbaseurl=https://artifacts.elastic.co/packages/6.x/yumgpgcheck=1gpgkey=https://artifacts.elastic.co/GPG-KEY-elasticsearchenabled=1autorefresh=1type=rpm-md |
yum install logstash
配置文件路径:
|
1
2
3
4
5
6
7
8
9
10
11
|
[root@localhost logstash]# pwd/etc/logstash[root@localhost logstash]# lltotal 36drwxrwxr-x. 2 root root 6 Oct 16 00:57 conf.d-rw-r--r--. 1 root root 1915 Oct 16 00:57 jvm.options-rw-r--r--. 1 root root 4568 Oct 16 00:57 log4j2.properties-rw-r--r--. 1 root root 342 Oct 16 00:57 logstash-sample.conf-rw-r--r--. 1 root root 8236 Nov 7 02:33 logstash.yml-rw-r--r--. 1 root root 285 Oct 16 00:57 pipelines.yml-rw-------. 1 root root 1696 Oct 16 00:57 startup.options |
日志文件路径:
|
1
2
3
4
5
6
|
[root@localhost logstash]# pwd/var/log/logstash[root@localhost logstash]# lltotal 4-rw-r--r--. 1 logstash logstash 1644 Nov 7 02:36 logstash-plain.log-rw-r--r--. 1 logstash logstash 0 Nov 7 02:35 logstash-slowlog-plain.log |
logstash是用来收集日志,并对日志做过滤处理的,我们下面要分析的是系统日志,所以要编写一个收集日志的配置文件
vim /etc/logstash/conf.d/system.conf
|
1
2
3
4
5
6
7
8
9
10
11
12
13
14
|
input日志输入模块:日志的获取方式和路径input { file { path => "/var/log/messages" type => "system-log" start_position => "beginning" }}output日志的输出模块:导出你的数据output { elasticsearch { hosts => "192.168.10.129:9200" index => "system_log-%{+YYYY.MM.dd}" }} |
这里为了测试,将/var/log/messages日志的权限修改为了644
chmod 777 /var/log/messages
如果conf.d 下有多个配置文件需要修改pipelines.yml(管道)文件
|
1
2
3
4
|
- pipeline.id: main path.config: "/etc/logstash/conf.d/system.conf"- pipeline.id: sec path.config: "/etc/logstash/conf.d/sec.conf" |
配置开机自启动
[root@localhost ~]# systemctl enable logstash.service
启动logstash服务
[root@localhost ~]# systemctl start logstash.service
监听端口:
[root@localhost logstash]# netstat -lptnu|grep java
tcp6 0 0 127.0.0.1:9600 :::* LISTEN 6722/java
4 安装kibana
配置yum 源
|
1
2
3
4
5
6
7
8
|
[kibana-6.x]name=Kibana repository for 6.x packagesbaseurl=https://artifacts.elastic.co/packages/6.x/yumgpgcheck=1gpgkey=https://artifacts.elastic.co/GPG-KEY-elasticsearchenabled=1autorefresh=1type=rpm-md |
systemctl enable kibana.service
systemctl start kibana
配置kibana
这里只需要配置监听地址和elasticsearch的ip就可以了
vim /etc/kibana/kibana.yml
[root@localhost yum.repos.d]# cat /etc/kibana/kibana.yml |grep -v "^#"
server.port: 5601
server.host: "0.0.0.0"
elasticsearch.hosts: ["http://192.168.153.172:9200"]
启动服务:
Systemctl start kibana
监听端口:5601
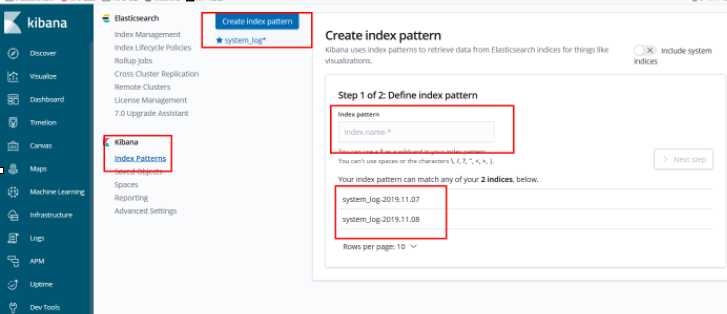
在kibana上创建索引
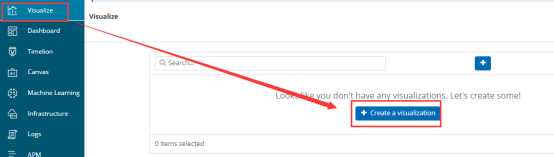
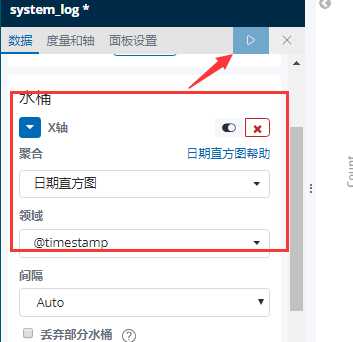
给系统日志添加可视化图形
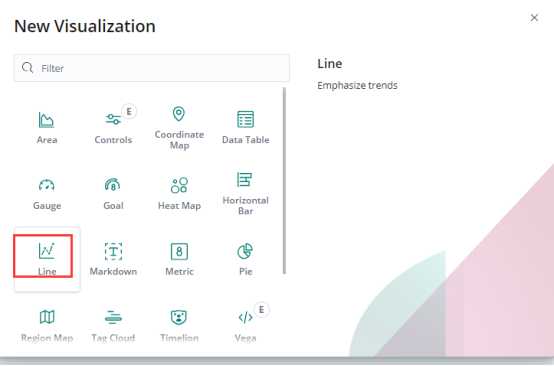
选择创建图形类型为线形图
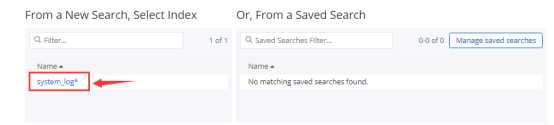
选择绘画哪个索引的图形
选择x轴为绘画日期的柱状图,然后点击开始获取数据
更多内容请关注:程相磊
标签:app elk etc 过滤 health 搭建 enforce store 一个
原文地址:https://www.cnblogs.com/leilei001/p/12047361.html