标签:监控项 打开 isa 参数 linu one bad 问题 ase
文章参考链接:https://blog.csdn.net/xiegh2014/article/details/84936174#commentBoxwget https://github.com/prometheus/prometheus/releases/download/v2.5.0/prometheus-2.5.0.linux-amd64.tar.gz
wget https://github.com/prometheus/node_exporter/releases/download/v0.17.0/node_exporter-0.17.0.linux-amd64.tar.gz
wget https://dl.grafana.com/oss/release/grafana-5.4.0-1.x86_64.rpm
yum localinstall grafana-5.4.0-1.x86_64.rpm问题1:
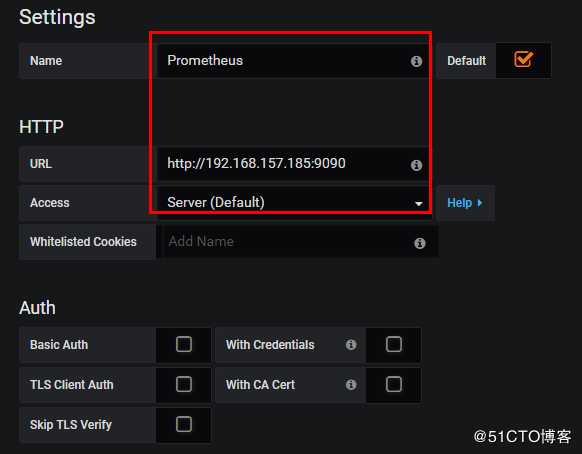
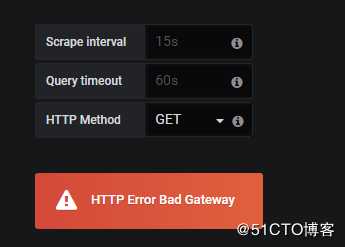
按照上面的文档进行实验搭建,完成后发现grafana无法正常显示出各个监控项,创建datasource时显示报错“HTTP Error Bad Gateway”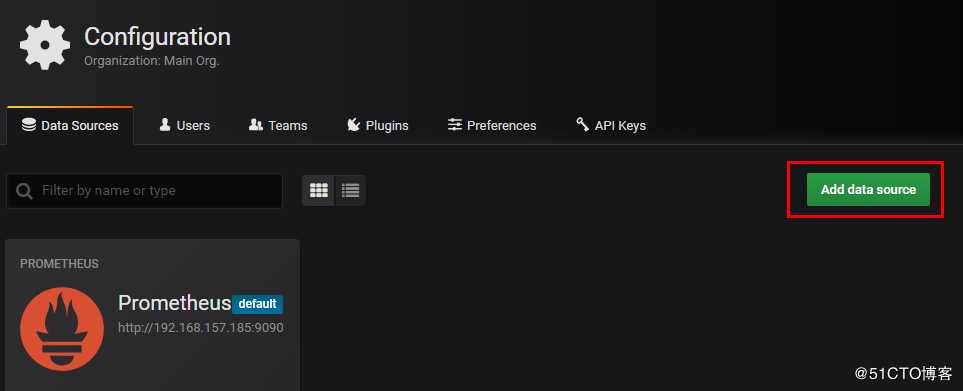
问题2:
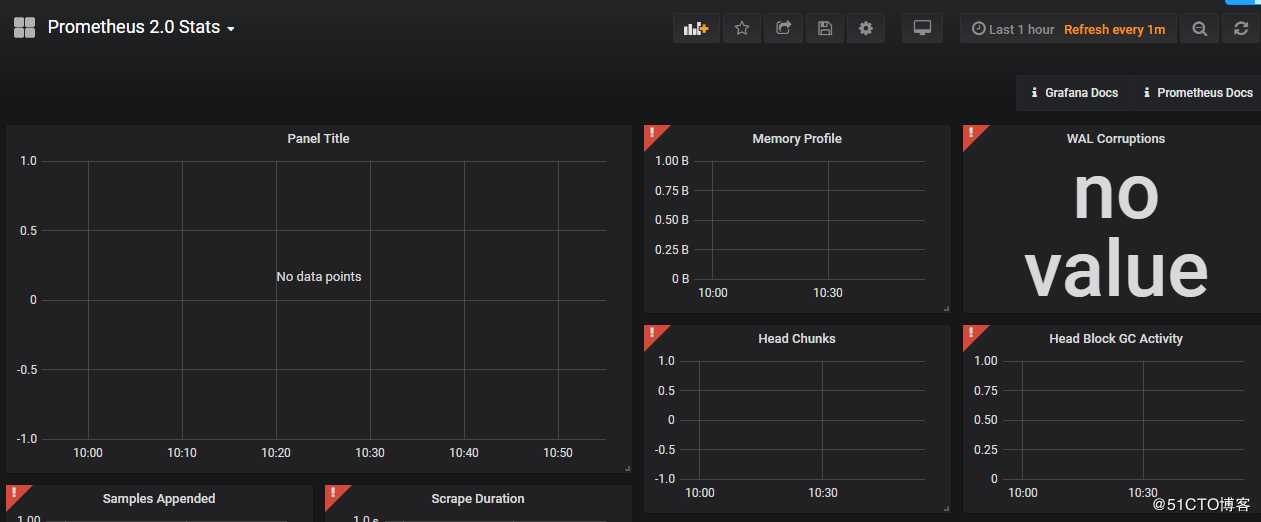
导入新模板时报错“Templating init failed”
导致只能显示为NA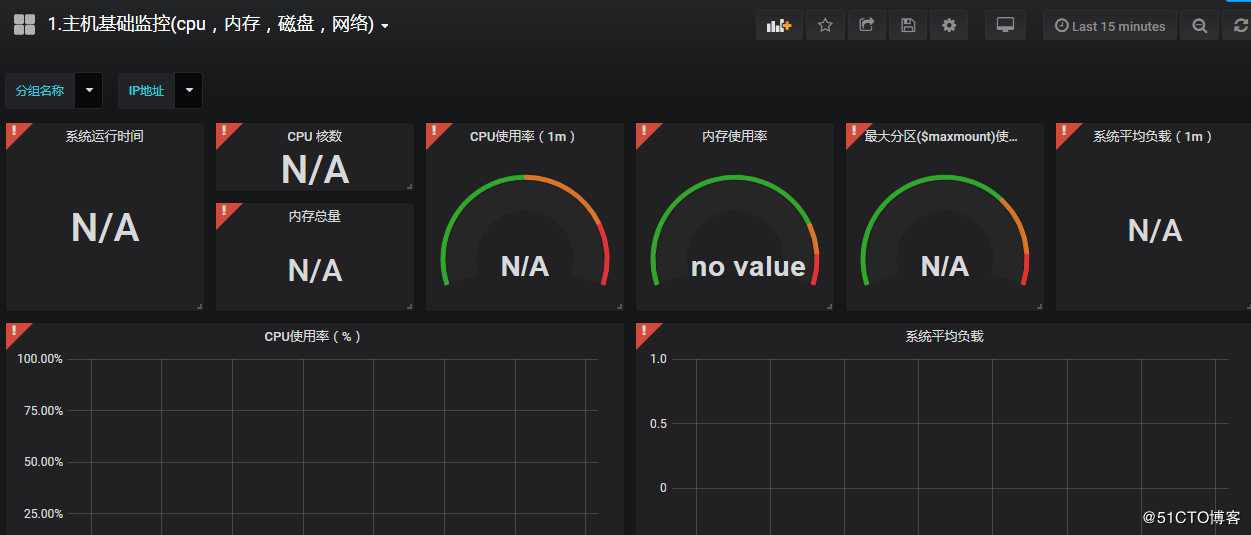
查看浏览器报错详情显示,"Failed to load resource: the server responded with a status of 502 (Bad Gateway)"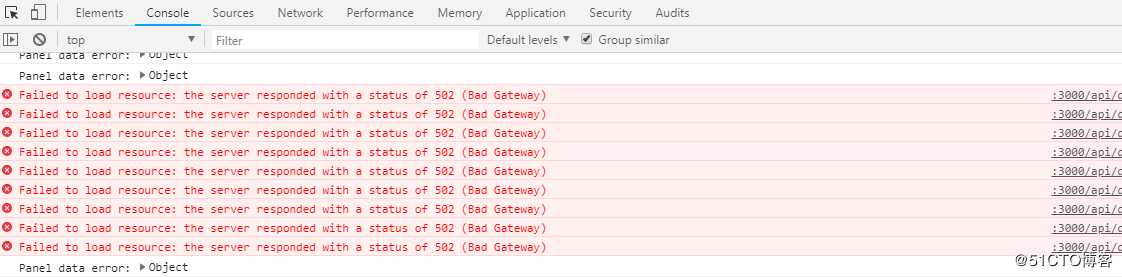
502错误代码表示服务器端无法响应请求报文,可能是服务器宕机或者中间的网络,DNS,防火墙等原因导致服务端无法响应。
问题排查:
1.查询prometheus服务是否起来
[root@localhost grafana]# systemctl status prometheus.service
● prometheus.service - Prometheus
   Loaded: loaded (/etc/systemd/system/prometheus.service; enabled; vendor preset: disabled)
   Active: failed (Result: start-limit) since Wed 2019-10-09 17:00:07 PDT; 18h ago
     Docs: https://prometheus.io/
 Main PID: 37669 (code=exited, status=203/EXEC)
发现竟然是failed,太坑爹了,之前好像是没起来,一放就忘了。难怪总是报错502的。
启动prometheus服务;
[root@localhost grafana]# systemctl enable prometheus.service
[root@localhost grafana]# systemctl start prometheus.service
[root@localhost grafana]# systemctl status prometheus.service
● prometheus.service - Prometheus
   Loaded: loaded (/etc/systemd/system/prometheus.service; enabled; vendor preset: disabled)
   Active: active (running) since Thu 2019-10-10 11:09:10 PDT; 7s ago
     Docs: https://prometheus.io/
 Main PID: 99212 (prometheus)
    Tasks: 1
   CGroup: /system.slice/prometheus.service
           └─99212 /usr/grafana/bin/prometheus --config.file=/usr/grafana/cfg/prometheus.yml...
然后登录9090端口查看状态,如果是如下状态表示是OK的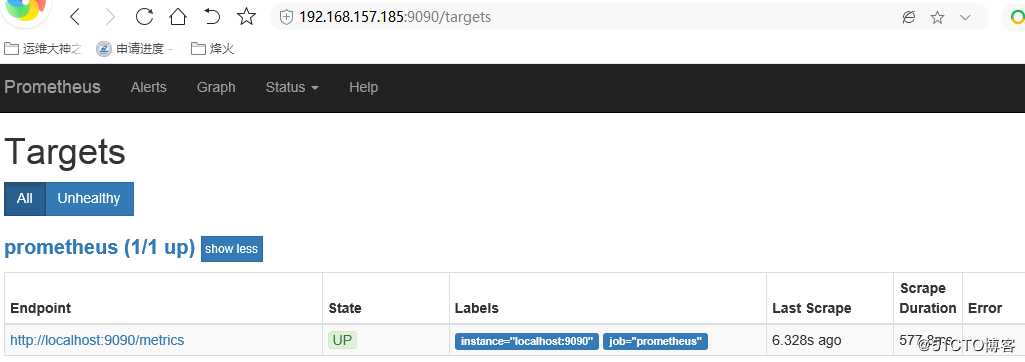
2.grafana上还是没有展示数据,查看日志发现有“404”的报错记录;tail /var/log/grafana/grafana.log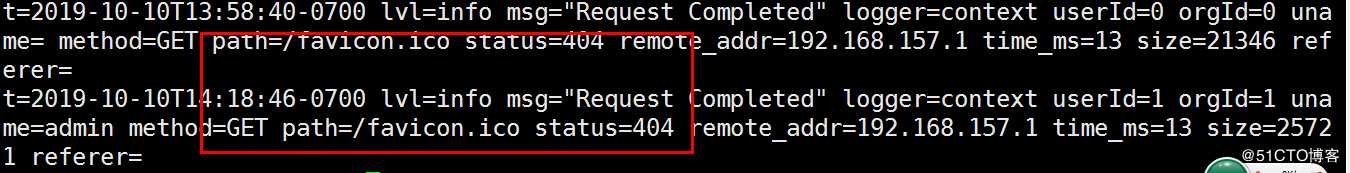
404 (未找到) 服务器找不到请求的网页
/etc/sysconfig/grafana-server --配置文件
3.检查prometheus的配置文件
参考此文档中关于prometheus的配置文件,发现了一个问题
https://blog.csdn.net/NRlovestudy/article/details/94727479
即配置文件里配置了对node_exporter的端口的监控,而我目前的配置中只配置了对prometheus端口的监控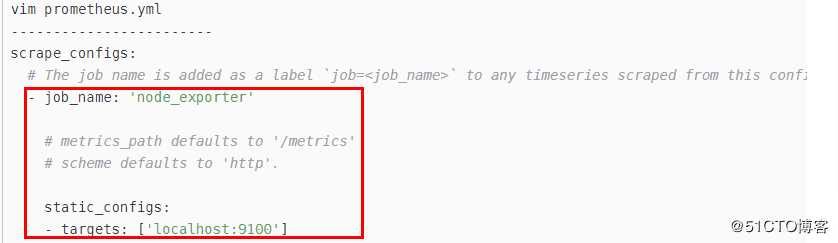
于是我将对node_exporter的监控加入到配置文件中
vim /usr/grafana/config/prometheus.yml
  - job_name: ‘node_exporter‘
    static_configs:
      - targets: [‘localhost:9100‘]
        labels:
          instance: server10
然后重启prometheus服务;
之后再打开http://localhost:3000页面,点击之前导入好的监控模板,观察是否有数据显示出来;
如果你的虚拟机的系统时间与你的主机系统时间不一致,那么需要等待一段时间后数据才会正常显示。
点击发现分组名称,IP地址这两个都可以选择了,而之前这里一直是None。
选择node_exporter,server10,发现数据能正常显示如下:
太激动了~~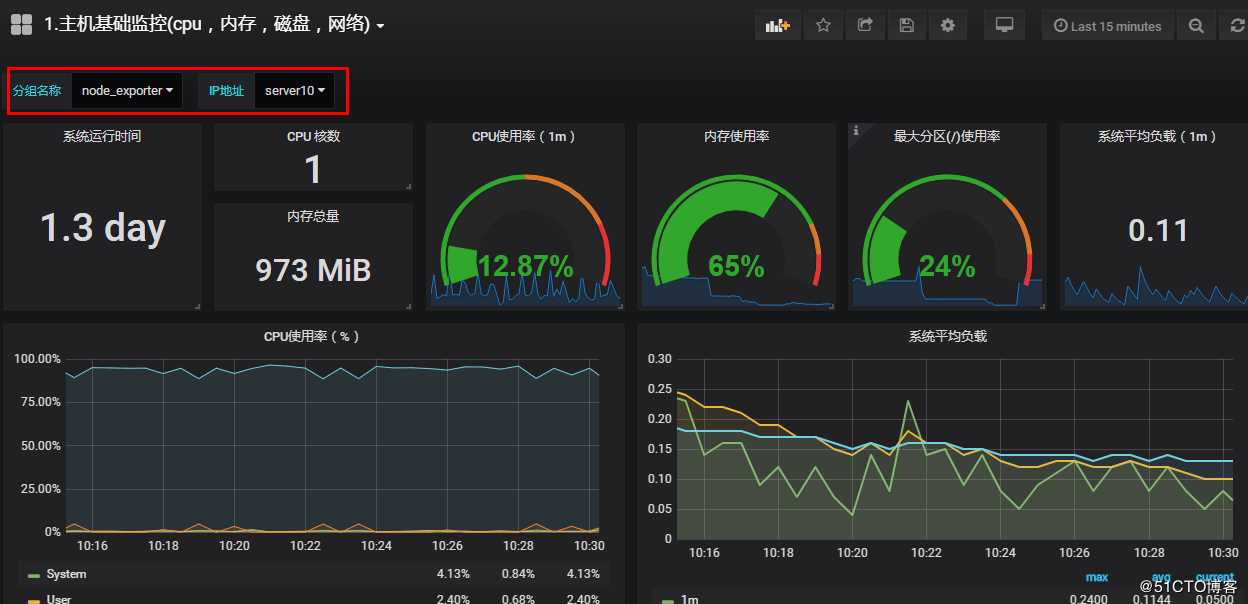
查看grafana的日志发现状态码为302,状态正常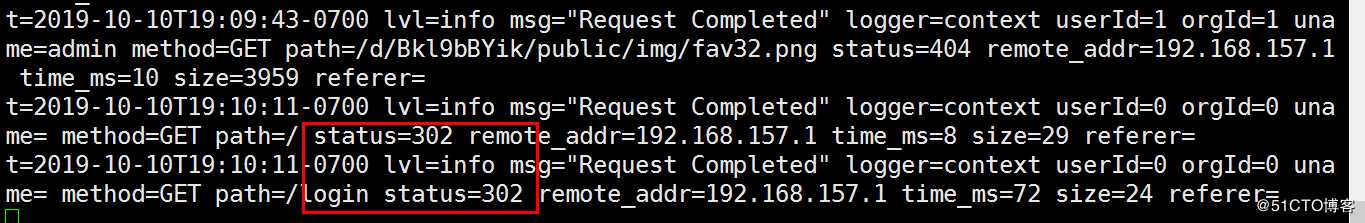
问题3:graph显示异常
现象是登录http://192.168.157.185时,界面不能显示任何可选项
解决方法如下:
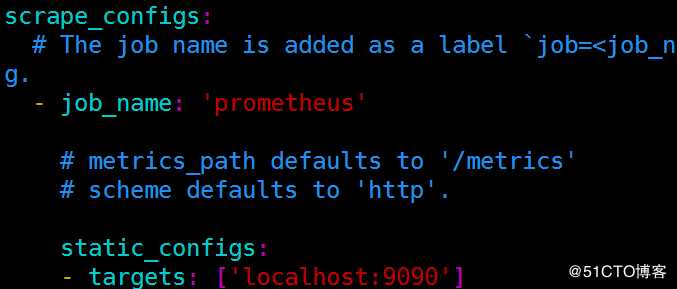
针对server端prometheus和监控端node_explorer端各设置一个监控对象,包括监控的名称和端口
scrape_configs:
# The job name is added as a label `job=<job_name>` to any timeseries scraped from this config.
- job_name: ‘prometheus‘
# metrics_path defaults to ‘/metrics‘
# scheme defaults to ‘http‘.
static_configs:
- targets: [‘localhost:9090‘]
labels:
instance: prometheus
- job_name: ‘node_exporter‘
static_configs:
- targets: [‘localhost:9100‘]
labels:
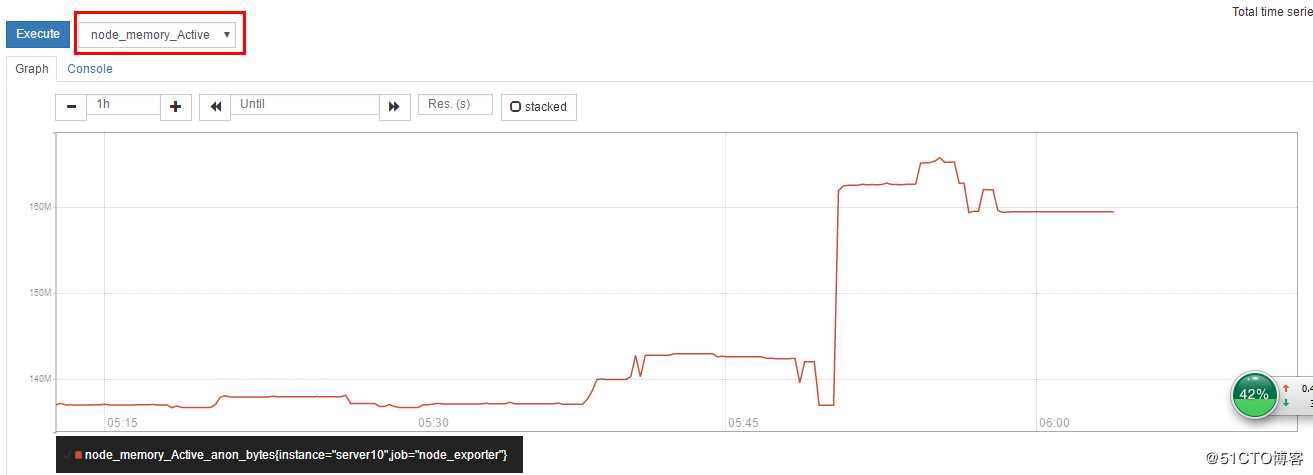
instance: server10设置好之后重启prometheus可得如下界面则显示正常,可以选择想要查看的监控项,点击execute,点击graph可以生成该监控参数的趋势图。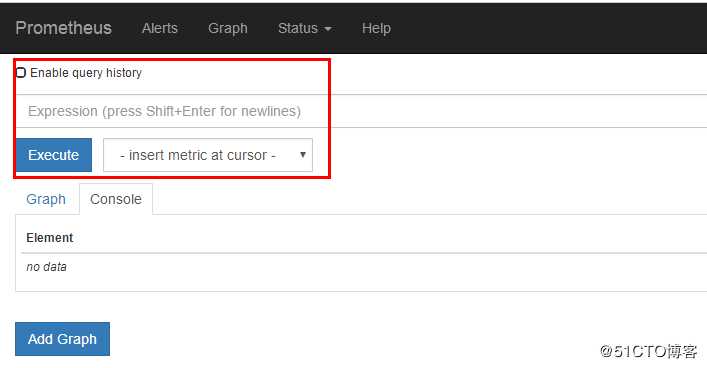
如果prometheus配置文件不规范或格式有问题可能会导致prometheus启动后状态一直为“inactive”的状态。此时需要仔细比对,查找出不规范的地方。
CentOS7+Prometheus2.5+Grafana5.4监控部署实验问题解决
标签:监控项 打开 isa 参数 linu one bad 问题 ase
原文地址:https://blog.51cto.com/13867332/2461806