标签:tick 坐标轴 gre str time ade pre 使用 save
要想在文本中使用LATEX,你需要使用‘$...$‘这种字符串(即使用‘$‘作为界定符)。通常建议使用raw字符串,即r‘$...$‘的格式,因为原生字符串不会转义‘\‘,从而使得大量的LATEX词法能够正确解析。
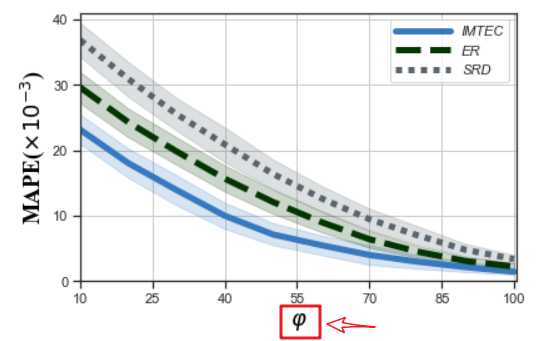
举例:
sns.set(style=‘ticks‘)
sns.set_context(rc={‘lines.linewidth‘:5})

plt.xlim((10,100.5))
plt.ylim((0,41))
plt.xticks(np.arange(10, 100.5, 15))
plt.yticks(np.arange(0,41,10))
# "greyish", "faded green",
colors = ["windows blue", "dark green",  "slate grey"]
palette = sns.xkcd_palette(colors)
ax = sns.lineplot(x="phi", y="MAPE",hue = ‘alg‘, style=‘alg‘,data=df_mape_change_phi, markers = False,palette=palette)
# - 实线-- 短线-.短点相间线:虚点线
# ax.lines[0].set_linestyle("-")
# ax.lines[1].set_linestyle("-.")
# ax.lines[2].set_linestyle("--")
plt.xlabel(r‘$\varphi$‘, fontdict={‘color‘: ‘black‘,‘family‘: ‘Times New Roman‘,‘size‘: 18})
plt.ylabel(r‘MAPE($\times 10^{-3}$)‘, fontdict={‘color‘: ‘black‘,‘family‘: ‘Times New Roman‘,‘size‘: 18})
plt.legend([‘IMTEC‘,‘ER‘,‘SRD‘],prop={‘style‘: ‘italic‘},handlelength=4)#图例
plt.grid(True)
plt.tight_layout()
plt.savefig(‘local_pic/phi_mape.jpg‘,dpi=600)
# plt.savefig(‘loc_svg/TD_precision_tasknum.svg‘)
plt.show()
标签:tick 坐标轴 gre str time ade pre 使用 save
原文地址:https://www.cnblogs.com/nxf-rabbit75/p/12099147.html