标签:dev 代码 npm width 线图 ret list rtp 堆叠
首先在cmd中输入指令,ECharts 和 zrender 安装完成会放在node_modules目录下可以直接在项目代码中 require(‘echarts‘) 得到 ECharts
npm install echarts --save
之后直接页面使用Echarts
HTML代码
<template>
    <div class="chart" ref="myEchart"></div>
</template>
script代码
<script>
  export default {
    name: ‘chart‘,
    data() {
      return {

      }
    },
    mounted() {
      this.getPillar();
    },
    methods: {

      // 渲染图表
      getPillar() {
        var echarts = require(‘echarts‘);
        // 基于准备好的dom(myEchartPillar),初始化echarts实例
        let myChart = echarts.init(this.$refs.myEchart);
        //指定图表的配置项和数据,绘制图表
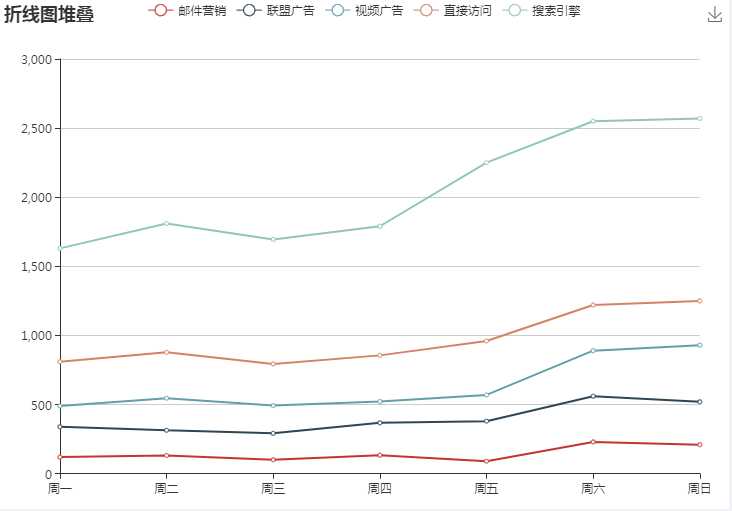
        myChart.setOption({
          title: {
            text: ‘折线图堆叠‘
          },
          tooltip: {
            trigger: ‘axis‘
          },
          legend: {
            data: [‘邮件营销‘, ‘联盟广告‘, ‘视频广告‘, ‘直接访问‘, ‘搜索引擎‘]
          },
          grid: {
            left: ‘3%‘,
            right: ‘4%‘,
            bottom: ‘3%‘,
            containLabel: true
          },
          toolbox: {
            feature: {
              saveAsImage: {}
            }
          },
          xAxis: {
            type: ‘category‘,
            boundaryGap: false,
            data: [‘周一‘, ‘周二‘, ‘周三‘, ‘周四‘, ‘周五‘, ‘周六‘, ‘周日‘]
          },
          yAxis: {
            type: ‘value‘
          },
          series: [{
              name: ‘邮件营销‘,
              type: ‘line‘,
              stack: ‘总量‘,
              data: [120, 132, 101, 134, 90, 230, 210]
            },
            {
              name: ‘联盟广告‘,
              type: ‘line‘,
              stack: ‘总量‘,
              data: [220, 182, 191, 234, 290, 330, 310]
            },
            {
              name: ‘视频广告‘,
              type: ‘line‘,
              stack: ‘总量‘,
              data: [150, 232, 201, 154, 190, 330, 410]
            },
            {
              name: ‘直接访问‘,
              type: ‘line‘,
              stack: ‘总量‘,
              data: [320, 332, 301, 334, 390, 330, 320]
            },
            {
              name: ‘搜索引擎‘,
              type: ‘line‘,
              stack: ‘总量‘,
              data: [820, 932, 901, 934, 1290, 1330, 1320]
            }
          ]
        });
        //解决自适应
        setTimeout(function() {
          window.addEventListener("resize", () => {
            myChart.resize();
          });
        }, 500);
      }
    }
  }
</script>
style代码
<style>
.chart{
  width: 100%;
  height: 100%;
}
</style>
案例展示

标签:dev 代码 npm width 线图 ret list rtp 堆叠
原文地址:https://www.cnblogs.com/suifengruye/p/12108048.html