标签:数组 label 表达式 highlight com lambda n+1 http code
1.三次样条插值函数
%%三次样条插值
%%bc为boundary conditions(边界条件),当已知两端点的一阶导数值时为-1,当已知两端的二阶导数时为0,当函数为周期函数时为1
%%X为节点值,Y为函数表达式(attribute=0)或者具体值(attribute=1)
function CSI = Cubic_spline_interpolation(X,Y,precision,attribute,bc)
[m,n] = size(X);a = min(X);b = max(X);n = n-1;
X = sort(X);

%%画已知函数或已知点图像
if attribute == 0
    F = subs(Y,X);
    t = a:(b-a)/precision:b;
    Y_real = subs(Y,t);
    pic = figure;
    set(pic,‘color‘,‘w‘);
    plot(X,F,‘r*‘,t,Y_real,‘b‘);
    grid on
    xlabel(‘x shaft‘);ylabel(‘y shaft‘);
    title(‘三次样条插值‘);
    hold on
elseif attribute ==1
    F = Y;
    pic = figure;
    set(pic,‘color‘,‘w‘);
    plot(X,F,‘r*‘);
    grid on
    xlabel(‘x shaft‘);ylabel(‘y shaft‘);
    title(‘三次样条插值‘);
    hold on
end

if bc == -1
    left_endpoint = input(‘输入左端点的一阶导数值:‘);
    right_endpoint = input(‘输入右端点的一阶导数值:‘);
    for i = 1:n
        X_one_interval{i} = [X(i),X(i+1)];%%节点构造区间
        F_one_interval{i} = [F(i),F(i+1)];%%构造节点值区间
        F_all_bad(i) = The_first_order_All_bad(F_one_interval{i},X_one_interval{i},attribute);%%节点区间的一阶均差
        h(i) = X(i+1)-X(i);
    end
    %%样条插值算法
    for i = 1:n-1
        mu(i) = h(i)/(h(i)+h(i+1));
    end
    mu(n) = 1;
    lambda(1) = 1;
    for i = 2:n
        lambda(i) = h(i)/(h(i-1)+h(i));
    end
    d(1)=6*(F_all_bad(1)-left_endpoint)/h(1);
    for i = 2:n
        d(i) = 6*(F_all_bad(i)-F_all_bad(i-1))/(h(i-1)+h(i));
    end
    d(n+1) = 6*(right_endpoint-F_all_bad(n))/h(n);
    A = zeros(n+1,n+1);
    for i = 1:n+1
        for j = 1:n+1
            if i == j
                A(i,j) = 2;
            elseif (i-j) == 1
                A(i,j) = mu(j);
            elseif (j-i) == 1
                A(i,j) = lambda(i);
            end
        end
    end
    %%解样条算法中的线性方程组得出解
    disp(‘样条函数初始系数:‘);
    M = vpa((A\d‘)‘,6)
    %%输出节点区间及对应的样条函数
    syms x;
    for i = 1:n
        CSI{1,i} = X_one_interval{i};
        CSI{2,i} = vpa((X(i+1)-x)^3*M(i)/(6*h(i))+(x-X(i))^3*M(i+1)/(6*h(i))+(F(i)-M(i)*h(i)^2/6)*(X(i+1)-x)/h(i)+(F(i+1)-M(i+1)*h(i)^2/6)*(x-X(i))/h(i),5);
    end
    %%画样条函数的图像
    for i = 1:n
        t_pic{i} = X(i):(X(i+1)-X(i))/precision:X(i+1);
        T_pic{i} = subs(CSI{2,i},t_pic{i});
    end
    for i = 1:n
        t_Pic(1+(precision+1)*(i-1):(precision+1)*i) = t_pic{i};
        T_Pic(1+(precision+1)*(i-1):(precision+1)*i) = T_pic{i};
    end
    plot(t_Pic,T_Pic,‘g‘);

    if attribute ==0
        legend(‘F:数据点‘,‘Y_real:真实图像‘,‘T_Pic:样条插值拟合函数‘);
    elseif attribute == 1
        legend(‘F:数据点‘,‘T_Pic:样条插值拟合函数‘);
    end
elseif bc == 0
    left_endpoint = input(‘输入左端点的二阶导数值:‘);
    right_endpoint = input(‘输入右端点的二阶导数值:‘);
    for i = 1:n
        X_one_interval{i} = [X(i),X(i+1)];
        F_one_interval{i} = [F(i),F(i+1)];
        F_all_bad(i) = The_first_order_All_bad(F_one_interval{i},X_one_interval{i},attribute);
        h(i) = X(i+1)-X(i);
    end
    for i = 1:n-1
        mu(i) = h(i)/(h(i)+h(i+1));
    end
    mu(n) = 0;
    lambda(1) = 0;
    for i = 2:n
        lambda(i) = h(i)/(h(i-1)+h(i));
    end
    d(1)=2*left_endpoint;
    for i = 2:n
        d(i) = 6*(F_all_bad(i)-F_all_bad(i-1))/(h(i-1)+h(i));
    end
    d(n+1) = 2*right_endpoint;
    A = zeros(n+1,n+1);
    for i = 1:n+1
        for j = 1:n+1
            if i == j
                A(i,j) = 2;
            elseif (i-j) == 1
                A(i,j) = mu(j);
            elseif (j-i) == 1
                A(i,j) = lambda(i);
            end
        end
    end
    disp(‘样条函数初始系数:‘);
    M = vpa((A\d‘)‘,6)
    syms x;
    for i = 1:n
        CSI{1,i} = X_one_interval{i};
        CSI{2,i} = vpa((X(i+1)-x)^3*M(i)/(6*h(i))+(x-X(i))^3*M(i+1)/(6*h(i))+(F(i)-M(i)*h(i)^2/6)*(X(i+1)-x)/h(i)+(F(i+1)-M(i+1)*h(i)^2/6)*(x-X(i))/h(i),5);
    end
    for i = 1:n
        t_pic{i} = X(i):(X(i+1)-X(i))/precision:X(i+1);
        T_pic{i} = subs(CSI{2,i},t_pic{i});
    end
    for i = 1:n
        t_Pic(1+(precision+1)*(i-1):(precision+1)*i) = t_pic{i};
        T_Pic(1+(precision+1)*(i-1):(precision+1)*i) = T_pic{i};
    end
    plot(t_Pic,T_Pic,‘g‘);
    if attribute ==0
        legend(‘F:数据点‘,‘Y_real:真实图像‘,‘T_Pic:样条插值拟合函数‘);
    elseif attribute == 1
        legend(‘F:数据点‘,‘T_Pic:样条插值拟合函数‘);
    end
end
end
2.一阶均差函数
%%一阶均差
function FAb = The_first_order_All_bad(f,X,attribute)
[m,n] = size(X);
if attribute == 0
    F = subs(f,X);
    FAb = (F(n)-F(1))/(X(n)-X(1));
elseif attribute == 1
    FAb = (f(n)-f(1))/(X(n)-X(1));
end
end
3.样条插值拟合值函数
%%三次样条插值拟合值
%%用法同三次样条函数
function CSIV = Cubic_spline_interpolation_value(X,Y,precision,attribute,bc,x_value)
[m,n] = size(X);a = min(X);b = max(X);n = n-1;
X = sort(X);
if attribute == 0
    F = subs(Y,X);
elseif attribute ==1
    F = Y;
end
if bc == -1
    left_endpoint = input(‘输入左端点的一阶导数值:‘);
    right_endpoint = input(‘输入右端点的一阶导数值:‘);
    for i = 1:n
        X_one_interval{i} = [X(i),X(i+1)];
        F_one_interval{i} = [F(i),F(i+1)];
        F_all_bad(i) = The_first_order_All_bad(F_one_interval{i},X_one_interval{i},attribute);
        h(i) = X(i+1)-X(i);
    end
    for i = 1:n-1
        mu(i) = h(i)/(h(i)+h(i+1));
    end
    mu(n) = 1;
    lambda(1) = 1;
    for i = 2:n
        lambda(i) = h(i)/(h(i-1)+h(i));
    end
    d(1)=6*(F_all_bad(1)-left_endpoint)/h(1);
    for i = 2:n
        d(i) = 6*(F_all_bad(i)-F_all_bad(i-1))/(h(i-1)+h(i));
    end
    d(n+1) = 6*(right_endpoint-F_all_bad(n))/h(n);
    A = zeros(n+1,n+1);
    for i = 1:n+1
        for j = 1:n+1
            if i == j
                A(i,j) = 2;
            elseif (i-j) == 1
                A(i,j) = mu(j);
            elseif (j-i) == 1
                A(i,j) = lambda(i);
            end
        end
    end
    M = (A\d‘)‘;
    syms x;
    for i = 1:n
        S{1,i} = X_one_interval{i};
        S{2,i} = vpa((X(i+1)-x)^3*M(i)/(6*h(i))+(x-X(i))^3*M(i+1)/(6*h(i))+(F(i)-M(i)*h(i)^2/6)*(X(i+1)-x)/h(i)+(F(i+1)-M(i+1)*h(i)^2/6)*(x-X(i))/h(i),5);
    end
    for i =1:n
        if x_value >= X(i) && x_value <= X(i+1);
            s = i;
        end
    end
    CSIV{1,1} = ‘拟合值‘;
    CSIV{2,1} = vpa(subs(S{2,s},x_value),4);
    CSIV{1,2} = ‘实际值‘;
    CSIV{2,2} = vpa(subs(Y,x_value),4);
    CSIV{1,3} = ‘误差‘;
    CSIV{2,3} = abs(CSIV{2,1}-CSIV{2,2});

elseif bc == 0
    left_endpoint = input(‘输入左端点的二阶导数值:‘);
    right_endpoint = input(‘输入右端点的二阶导数值:‘);
    for i = 1:n
        X_one_interval{i} = [X(i),X(i+1)];
        F_one_interval{i} = [F(i),F(i+1)];
        F_all_bad(i) = The_first_order_All_bad(F_one_interval{i},X_one_interval{i},attribute);
        h(i) = X(i+1)-X(i);
    end
    for i = 1:n-1
        mu(i) = h(i)/(h(i)+h(i+1));
    end
    mu(n) = 0;
    lambda(1) = 0;
    for i = 2:n
        lambda(i) = h(i)/(h(i-1)+h(i));
    end
    d(1)=2*left_endpoint;
    for i = 2:n
        d(i) = 6*(F_all_bad(i)-F_all_bad(i-1))/(h(i-1)+h(i));
    end
    d(n+1) = 2*right_endpoint;
    A = zeros(n+1,n+1);
    for i = 1:n+1
        for j = 1:n+1
            if i == j
                A(i,j) = 2;
            elseif (i-j) == 1
                A(i,j) = mu(j);
            elseif (j-i) == 1
                A(i,j) = lambda(i);
            end
        end
    end
    M = (A\d‘)‘;
    syms x;
    for i = 1:n
        S{1,i} = X_one_interval{i};
        S{2,i} = vpa((X(i+1)-x)^3*M(i)/(6*h(i))+(x-X(i))^3*M(i+1)/(6*h(i))+(F(i)-M(i)*h(i)^2/6)*(X(i+1)-x)/h(i)+(F(i+1)-M(i+1)*h(i)^2/6)*(x-X(i))/h(i),5);
    end
    CSIV{1,1} = ‘拟合值‘;
    CSIV{2,1} = vpa(subs(S{2,s},x_value),4);
end
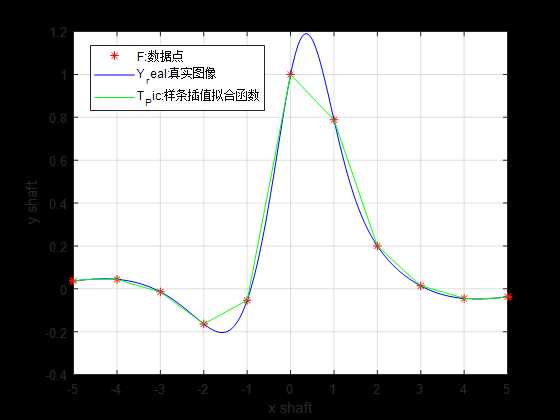
4.例子
clear all
clc
syms x;
Y=sin(x)/(1+x^2)+exp(-x^2);
X=-5:1:5;
precision=500;
attribute=0;
bc=-1;

%%三次样条插值
Cubic_spline_interpolation(X,Y,precision,attribute,bc)
结果为
输入左端点的一阶导数值:subs(diff(Y),-5)
输入右端点的一阶导数值:subs(diff(Y),5)
样条函数初始系数:
M =
[ -0.0869325, 0.0232929, -0.00623918, 0.00166378, -0.000415945, 1.32899e-12, 0.000415945, -0.00166378, 0.00623918, -0.0232929, 0.0869325]
S =
  2×10 cell 数组
  列 1 至 4
    {1×2 double}    {1×2 double}    {1×2 double}    {1×2 double}
    {1×1 sym   }    {1×1 sym   }    {1×1 sym   }    {1×1 sym   }
  列 5 至 8
    {1×2 double}    {1×2 double}    {1×2 double}    {1×2 double}
    {1×1 sym   }    {1×1 sym   }    {1×1 sym   }    {1×1 sym   }
  列 9 至 10
    {1×2 double}    {1×2 double}
    {1×1 sym   }    {1×1 sym   }
>> S{2,:}
ans =
0.014489*(x + 4.0)^3 - 0.010735*x + 0.0038822*(x + 5.0)^3 - 0.0023031
ans =
- 0.053584*x - 0.0010399*(x + 4.0)^3 - 0.0038822*(x + 3.0)^3 - 0.1737
ans =
0.0010399*(x + 2.0)^3 - 0.15087*x + 0.0002773*(x + 3.0)^3 - 0.46557
ans =
0.11103*x - 0.0002773*(x + 1.0)^3 - 0.000069324*(x + 2.0)^3 + 0.058248
ans =
1.0528*x + 2.215e-13*(x + 1.0)^3 + 0.000069324*x^3 + 1.0
ans =
0.000069324*x^3 - 2.215e-13*(x - 1.0)^3 - 0.21145*x + 1.0
ans =
1.3766 - 0.0002773*(x - 1.0)^3 - 0.000069324*(x - 2.0)^3 - 0.58809*x
ans =
0.0010399*(x - 2.0)^3 - 0.18726*x + 0.0002773*(x - 3.0)^3 + 0.57497
ans =
0.17469 - 0.0010399*(x - 4.0)^3 - 0.0038822*(x - 3.0)^3 - 0.053831*x
ans =
0.014489*(x - 4.0)^3 - 0.010735*x + 0.0038822*(x - 5.0)^3 + 0.0023042
>>
函数图像为

标签:数组 label 表达式 highlight com lambda n+1 http code
原文地址:https://www.cnblogs.com/guliangt/p/12112735.html