import pandas as pd
import numpy as np
import matplotlib.pyplot as plt

class linear_regression(object):

    #计算均方误差损失
    def compute_loss(self,y,y_hat):
        return np.average((y-y_hat)**2)

    #梯度下降算法
    def compute_gradient(self,n,x,y):
        x[‘temp‘]=1
        w = np.zeros(len(x.columns))
        for i in range(n):
            w -= 0.00001*np.dot(x.T,(np.dot(x,w)-y))
        return w

    #数据标准化
    def stand_data(self,x):
        return (x-x.mean())/x.std()

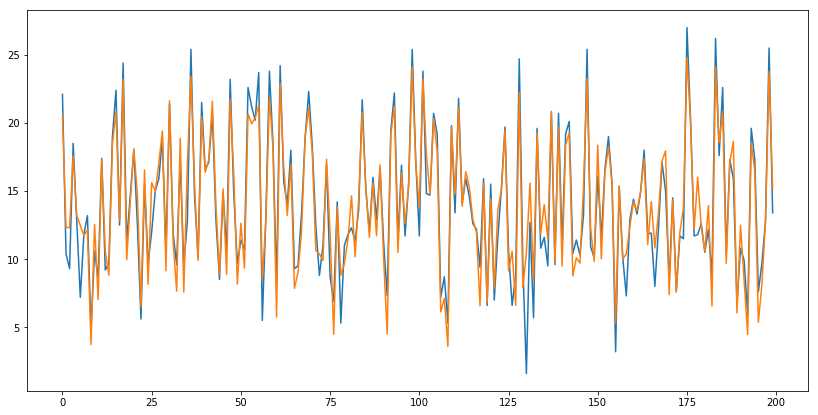
    #作图
    def plot_data(self,y,y_hat):
        fig,ax = plt.subplots()
        fig.set_size_inches(14,7)
        ax.plot(np.arange(len(y)),y)
        ax.plot(np.arange(len(y_hat)),y_hat)


if __name__ == ‘__main__‘:
    data = pd.read_csv(‘data.csv‘)
    x = data.iloc[:,1:-1]
    y = data.iloc[:,-1]
    lin_reg = linear_regression()
    #数据标准化
    x = lin_reg.stand_data(x)
    #标准化后求参数,在求参数过程中,自动给x增加一列偏移项1
    w = lin_reg.compute_gradient(10000,x,y)
    print(‘参数值:‘,w)
    #预测值
    y_hat = np.dot(x,w)
    #计算均方误差
    ls = lin_reg.compute_loss(y,y_hat)
    print(‘均方误差:‘,ls)
    #画图
    lin_reg.plot_data(y,y_hat)
参数值: [ 3.92908866 2.7990655 -0.02259148 14.02249997]
均方误差: 2.78412631453


