标签:pre mini pat 添加元素 数据分析 line lxml xpath 矢量图
#!usr/bin/env python
#-*- coding:utf-8 _*-
"""
@author:Administrator
@file: 可视化天气预报.py
@time: 2020/1/7 17:54
"""
from lxml import etree
import requests
import pygal

r = requests.get(‘http://www.weather.com.cn/weather/101250101.shtml‘, timeout=30)
r.raise_for_status()
r.encoding = r.apparent_encoding
html = r.text
#print(html)
ret = etree.HTML(html)

li_ltr = ret.xpath(‘//ul[@class="t clearfix"]/li‘)

Date_list = []
TempeMax = []
TempeMin = []
for li in li_ltr:
    date = li.xpath(‘./h1/text()‘)
    Date_list.append(date[0])
   # print(date)
    temerature_max  = li.xpath(‘./p[@class="tem"]/span/text()‘)
    #print(temerature_max[0])
    TempeMax.append(int(temerature_max[0]))
    temerature_min  = li.xpath(‘./p[@class="tem"]/i/text()‘)
    #print(temerature_min[0][0:-1])
    TempeMin.append(int(temerature_min[0][0:-1]))

if len(TempeMin)<=7:
    TempeMin.append(None)

if len(TempeMax)<=7:
    TempeMax.append(None)


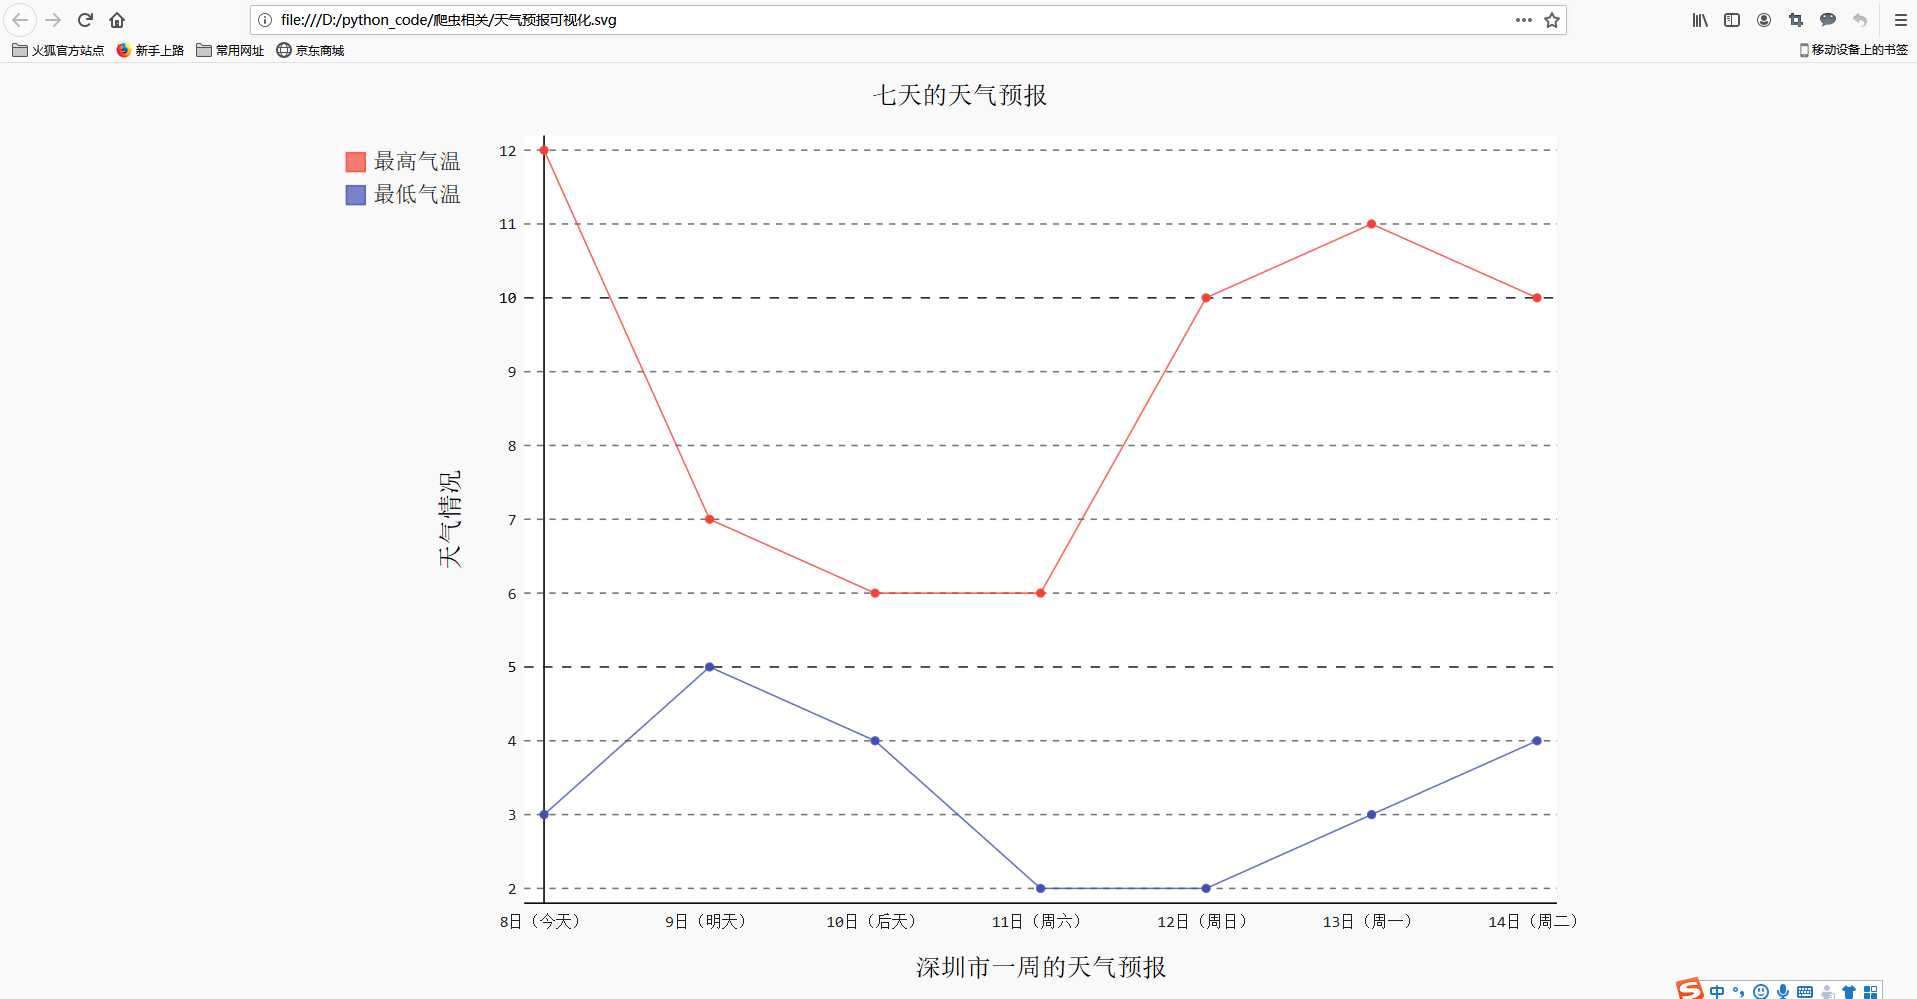
line_chart = pygal.Line()
line_chart.title = ‘七天的天气预报‘
line_chart.x_labels = Date_list
line_chart.y_title=‘天气情况‘
line_chart.x_title=‘深圳市一周的天气预报‘
line_chart.add(‘最高气温‘,TempeMax)        #add数据时,添加元素一定要是int整形
line_chart.add(‘最低气温‘,TempeMin)

line_chart.render_to_file(‘天气预报可视化.svg‘)  #svg 矢量图

标签:pre mini pat 添加元素 数据分析 line lxml xpath 矢量图
原文地址:https://www.cnblogs.com/wujf-myblog/p/12165859.html