标签:选择 参数 hang ima 代码 获取 src idt rgb
<LiquidFillChart style="height:170px;" :info="data1"></LiquidFillChart>
data1:{
        showLabel:true,
        data:[0.6, 0.5, 0.4, 0.3],
        color:["#0a69b6"],
        bgColor:"rgba(255,255,255,0)"
    },
<li class="li" :class="index ===0 ||index ===2  ? ‘li5‘ : ‘‘" v-for="(item,index) in dataList" :key="index">
    <h3>{{item.title}}</h3>
    <DatePicker v-if="item.isSelect" type="year" v-model="searchList[index].yearData" placeholder="请选择年份" style="width: 200px" @on-change="changeYear(index,$event)"></DatePicker>
    <component :is="item.component" class="echarts" :info="item.data"></component>
 </li>
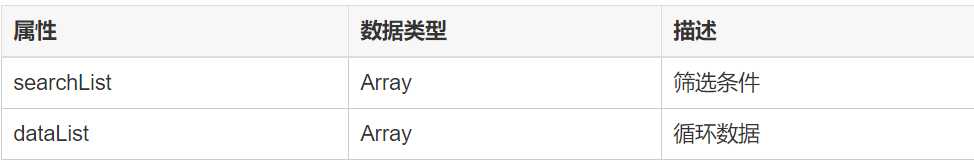
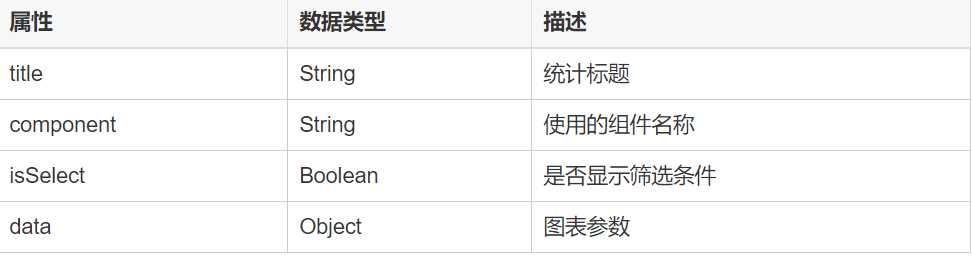
dataList: [
            {//报警处理情况所占比
              title: "报警处理情况所占比",
              component: ‘RingsChart2‘,
              isSelect: true,
              data: {
                seriesData: [
                  {
                    name: "处理情况",
                    data: []
                  },
                  {
                    name: "报警来源",
                    data: []
                  },
                ]

              }
            },
          ],
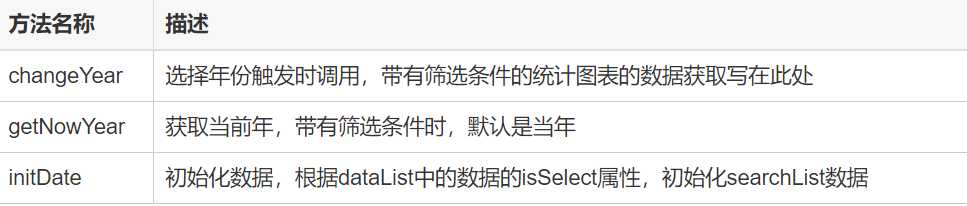
/**
        * 选择年份
        */
       changeYear(index, eventArg) {
         let param = {
           year: eventArg
         };
         const _this = this;
         switch (index) {
           //报警来源统计
           case 0:
             _this.$api.AlarmAnalysis.GetAlarmSource(param).then(res => {
               if (res.data.success) {
                 _this.dataList[index].data.xAxisData = res.data.result.alarmMonthData;
                 _this.dataList[index].data.legendData = res.data.result.typeNameData;
                 _this.dataList[index].data.seriesData.forEach((e, index0) => {
                   e.data = res.data.result.alarmData[index0];
                 })
               }
             });
             break;
           //报警处理情况所占比
           case 1:
             _this.$api.AlarmAnalysis.GetAlarmContent(param).then(res => {
               if (res.data.success) {
                 _this.dataList[index].data.seriesData[0].data = res.data.result[1];
                 _this.dataList[index].data.seriesData[1].data = res.data.result[0];
               }
             });
             break;
           //报警数量统计
           case 2:
             _this.$api.AlarmAnalysis.GetAlarmCount(param).then(res => {
               if (res.data.success) {
                 _this.dataList[index].data.xAxisData = res.data.result.xData;
                 _this.dataList[index].data.seriesData.forEach((e, index0) => {
                   e.name = res.data.result.arrayDatas[index0].name
                   e.data = res.data.result.arrayDatas[index0].data
                 })
               }
             });
             break;
         }

       },
       /**
        * 获取当年
        */
       getNowYear() {
         let date = new Date();
         return `${date.getFullYear()}`;
       },
       /**
        * 初始化数据
        */
       initDate() {
         this.dataList.forEach(e => {
           if (e.isSelect) {
             this.searchList.push({ yearData: this.getNowYear() })
           }
         });
         if (this.searchList.length > 0) {
           this.searchList.forEach((e, index) => {
             this.changeYear(index, e.yearData)
           })
         }
       }
页面加载时,初始化数据
如果有统计图表没有筛选条件也可将获取数据的代码写在initData方法中
标签:选择 参数 hang ima 代码 获取 src idt rgb
原文地址:https://www.cnblogs.com/cyqdeshenluo/p/12176088.html