标签:include one UNC pidof location null ams mem repo
一、监控Nginx、httpd、Tomcat、php-fpm、Redis
1、监控Nginx:
(1)web02节点安装Nginx
(2)开启Nginx状态页面:
# cd /etc/nginx
# cp nginx.conf{,.bak}
# vim nginx.conf,在server配置段中新增如下代码:
location = /nginx_status {
stub_status;
}
# nginx -t
# systemctl start nginx
# systemctl status nginx
(3)浏览器访问状态页面:http://192.168.11.207/nginx_status
Active connections: 2
server accepts handled requests
 2 2 1
Reading: 0 Writing: 1 Waiting: 1
说明:页面状态信息
Active connections:当前活动的客户端连接数,包括Waiting连接数
accepts:接收的客户端连接总数
handled:已处理的连接总数,通常该值与accepts的值相同,除非达到某些资源限制,如worker_connections
requests:客户端请求总数
Reading:Nginx正在读取请求头的当前连接数
Writing:Nginx正在将响应写回到客户端的当前连接数
Waiting:当前等待请求的空闲客户端连接数
(4)将nginx_monitor.sh脚本文件上传至/scripts目录,并赋予执行权限:# chmod +x /scripts/nginx_monitor.sh
[root@web02 scripts]# vim nginx_monitor.sh

#!/bin/bash
#Script to fetch nginx statuses for monitoring systems
#!/bin/bash
#Script to fetch nginx statuses for monitoring systems

HOST="127.0.0.1"
PORT="80"

function ping {
/sbin/pidof nginx | wc -l
}
function active {
/usr/bin/curl "http://$HOST:$PORT/nginx_status" 2>/dev/null| grep ‘Active‘ | awk ‘{print $NF}‘
}
function reading {
/usr/bin/curl "http://$HOST:$PORT/nginx_status" 2>/dev/null| grep ‘Reading‘ | awk ‘{print $2}‘
}
function writing {
/usr/bin/curl "http://$HOST:$PORT/nginx_status" 2>/dev/null| grep ‘Writing‘ | awk ‘{print $4}‘
}
function waiting {
/usr/bin/curl "http://$HOST:$PORT/nginx_status" 2>/dev/null| grep ‘Waiting‘ | awk ‘{print $6}‘
}
function accepts {
/usr/bin/curl "http://$HOST:$PORT/nginx_status" 2>/dev/null| awk NR==3 | awk ‘{print $1}‘
}
function handled {
/usr/bin/curl "http://$HOST:$PORT/nginx_status" 2>/dev/null| awk NR==3 | awk ‘{print $2}‘
}
function requests {
/usr/bin/curl "http://$HOST:$PORT/nginx_status" 2>/dev/null| awk NR==3 | awk ‘{print $3}‘
}
$1
(5)将nginx_status.conf配置文件上传至/etc/zabbix/zabbix_agentd.d目录,并重启Zabbix Agent:
[root@web02 zabbix_agentd.d]# vim nginx_status.conf

UserParameter=nginx_status[*],/scripts/nginx_monitor.sh $1
# systemctl restart zabbix-agent
(6)web01节点使用zabbix-get进行取值测试:
# zabbix_get -s 192.168.11.207 -k nginx_status[active]
# zabbix_get -s 192.168.11.207 -k nginx_status[accepts]
# zabbix_get -s 192.168.11.207 -k nginx_status[requests]

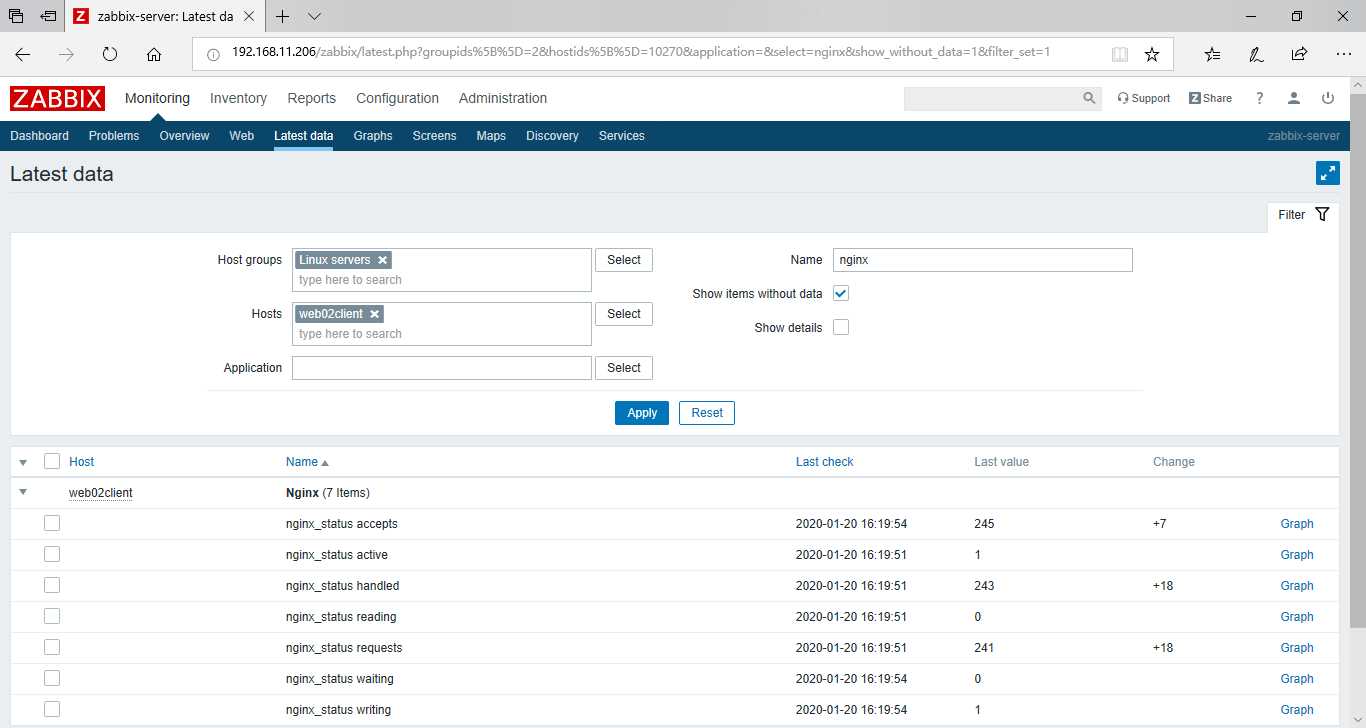
(7)新建监控项目后,自定义模块,加入到监控主机
2、监控httpd:
(1)web02节点安装httpd,修改httpd-server-status.conf的内容;
[root@web02 conf.d]# vim httpd-server-status.conf

#
# This is a sample Apache config file to setup status page.
# Put it in /etc/httpd/conf.d/ or otherwise integrate with Apache conf.
#

#
# ExtendedStatus controls whether Apache will generate "full" status
# information (ExtendedStatus On) or just basic information (ExtendedStatus
# Off) when the "server-status" handler is called. The default is Off.
#
ExtendedStatus On

#
# Allow server status reports generated by mod_status,
# with the URL of http://servername/server-status
# Change the ".example.com" to match your domain to enable.
#
<Location /server-status>
    SetHandler server-status
    Require all granted
#    Order deny,allow
#    Deny from all
#    Allow from localhost
</Location>
ExtendedStatus On
(2)将httpd-server-status.conf配置文件上传至/etc/httpd/conf.d目录,开启httpd状态页面
[root@web02 zabbix_agentd.d]# vim userparameter_zapache.conf
UserParameter=zapache[*],/scripts/zapache $1
# httpd -t
# systemctl start httpd
# systemctl status httpd
(3)浏览器访问状态页面:http://192.168.11.207/server-status
____W...........................................................
................................................................
................................................................
................................................................
Scoreboard Key:
"_" Waiting for Connection, "S" Starting up, "R" Reading Request,
"W" Sending Reply, "K" Keepalive (read), "D" DNS Lookup,
"C" Closing connection, "L" Logging, "G" Gracefully finishing,
"I" Idle cleanup of worker, "." Open slot with no current process
| Srv | PID | Acc | M | CPU | SS | Req | Conn | Child | Slot | Client | VHost | Request |
|---|---|---|---|---|---|---|---|---|---|---|---|---|
| 4-0 | 92444 | 0/0/0 | W | 0.00 | 0 | 0 | 0.0 | 0.00 | 0.00 | 192.168.11.100 | 192.168.11.207:8001 | GET /server-status HTTP/1.1 |
| Srv | Child Server number - generation |
|---|---|
| PID | OS process ID |
| Acc | Number of accesses this connection / this child / this slot |
| M | Mode of operation |
| CPU | CPU usage, number of seconds |
| SS | Seconds since beginning of most recent request |
| Req | Milliseconds required to process most recent request |
| Conn | Kilobytes transferred this connection |
| Child | Megabytes transferred this child |
| Slot | Total megabytes transferred this slot |
(4)将zapache脚本文件上传至/scripts目录,并赋予执行权限:# chmod +x /scripts/zapache

1 #! /bin/bash
  2 #
  3 # Name: zapache
  4 #
  5 # Checks Apache activity.
  6 #
  7 # Author: Alejandro Michavila
  8 # Modified for Scoreboard Values: Murat Koc, murat@profelis.com.tr
  9 # Modified for using also as external script: Murat Koc, murat@profelis.com.tr
 10 # Modified for outputting usage or ZBX_NOTSUPPORTED: Alejandro Michavila
 11 # Modified to do cacheing for performance, dmitry.frolov@gmail.com
 12 #
 13 # Version: 1.5
 14 #
 15
 16 zapachever="1.5"
 17 rval=0
 18 value=""
 19 cache_seconds="60"
 20 [ "$TMPDIR" ] || TMPDIR=/tmp
 21
 22 function usage()
 23 {
 24         echo "zapache version: $zapachever"
 25         echo "usage:"
 26         echo "  $0 [<url>] TotalAccesses                 - Check total accesses."
 27         echo "  $0 [<url>] TotalKBytes                   - Check total KBytes."
 28         echo "  $0 [<url>] CPULoad                       - Check CPU load."
 29         echo "  $0 [<url>] Uptime                        - Check uptime."
 30         echo "  $0 [<url>] ReqPerSec                     - Check requests per second."
 31         echo "  $0 [<url>] BytesPerSec                   - Check Bytes per second."
 32         echo "  $0 [<url>] BytesPerReq                   - Check Bytes per request."
 33         echo "  $0 [<url>] BusyWorkers                   - Check busy workers."
 34         echo "  $0 [<url>] IdleWorkers                   - Check idle workers."
 35         echo "  $0 [<url>] version                       - Version of this script."
 36         echo "  $0 [<url>] ping                          - Check if Apache is up."
 37         echo "  $0 [<url>] WaitingForConnection          - Check Waiting for Connection p    rocessess."
 38         echo "  $0 [<url>] StartingUp                    - Check Starting Up processess."
 39         echo "  $0 [<url>] ReadingRequest                - Check Reading Request processe    ss."
 40         echo "  $0 [<url>] SendingReply                  - Check Sending Reply processess    ."
 41         echo "  $0 [<url>] KeepAlive                     - Check KeepAlive Processess."
 42         echo "  $0 [<url>] DNSLookup                     - Check DNSLookup Processess."
 43         echo "  $0 [<url>] ClosingConnection             - Check Closing Connection Proce    ssess."
 44         echo "  $0 [<url>] Logging                       - Check Logging Processess."
 45         echo "  $0 [<url>] GracefullyFinishing           - Check Gracefully Finishing Pro    cessess."
 46         echo "  $0 [<url>] IdleCleanupOfWorker           - Check Idle Cleanup of Worker P    rocessess."
 47         echo "  $0 [<url>] OpenSlotWithNoCurrentProcess  - Check Open Slots with No Curre    nt Process."
 48 }
 49
 50 ########
 51 # Main #
 52 ########
 53
 54 if [[ $# ==  1 ]];then
 55         #Agent Mode
 56         STATUS_URL="http://localhost/server-status?auto"
 57         CASE_VALUE="$1"
 58 elif [[ $# == 2 ]];then
 59         #External Script Mode
 60         STATUS_URL="$1"
 60         STATUS_URL="$1"
 61         case "$STATUS_URL" in
 62                 http://*|https://*) ;;
 63                 *) STATUS_URL="http://$STATUS_URL/server-status?auto";;
 64         esac
 65         CASE_VALUE="$2"
 66 else
 67         #No Parameter
 68         usage
 69         exit 0
 70 fi
 71
 72 case "$CASE_VALUE" in
 73 ‘version‘)
 74         echo "$zapachever"
 75         exit 0;;
 76 esac
 77
 78 umask 077
 79
 80 # $UID is bash-specific
 81 cache_prefix="zapache-$UID-${STATUS_URL//[^a-zA-Z0-9_-]/_}"
 82 cache="$TMPDIR/$cache_prefix.cache"
 83 cache_timestamp_check="$TMPDIR/$cache_prefix.ts"
 84 # This assumes touch from coreutils
 85 touch -d "@$((`date +%s` - ($cache_seconds - 1)))" "$cache_timestamp_check"
 86
 87 if [ "$cache" -ot "$cache_timestamp_check" ]; then
 88         curl="`which curl`"
 89         if [ "$curl" ]; then
 90                 fetch_url() { $curl --insecure --silent --location -H "Cache-Control: no-    cache" "$@"; }
 91         else
 92                 wget="`which wget`"
 93                 if [ "$wget" ]; then
 94                         fetch_url() { $wget --no-check-certificate --quiet --header "Cach    e-Control: no-cache" -O - "$@"; }
 95                 else
 96                         echo "ZBX_NOTSUPPORTED"
 97                         exit 1
 98                 fi
 99         fi
100
101         fetch_url "$STATUS_URL" > "$cache"
102         rval=$?
103         if [ $rval != 0 ]; then
104                 echo "ZBX_NOTSUPPORTED"
105                 exit 1
106         fi
107 fi
108
109 case "$CASE_VALUE" in
110 ‘ping‘)
111         if [ ! -s "$cache" -o "$cache" -ot "$cache_timestamp_check" ]; then
112                 echo "0"
113         else
114                 echo "1"
115         fi
116         exit 0;;
117 esac
118
119 if ! [ -s "$cache" ]; then
120         echo "ZBX_NOTSUPPORTED"
121         exit 1
122 fi
123
124 case "$CASE_VALUE" in
125 ‘TotalAccesses‘)
126         value="`awk ‘/^Total Accesses:/ {print $3}‘ < \"$cache\"`"
127         rval=$?;;
128 ‘TotalKBytes‘)
129         value="`awk ‘/^Total kBytes:/ {print $3}‘ < \"$cache\"`"
130         rval=$?;;
131 ‘CPULoad‘)
132         value="`awk ‘/^CPULoad:/ {print $2}‘ < \"$cache\"`"
133         rval=$?;;
134 ‘Uptime‘)
135         value="`awk ‘/^Uptime:/ {print $2}‘ < \"$cache\"`"
136         rval=$?;;
137 ‘ReqPerSec‘)
138         value="`awk ‘/^ReqPerSec:/ {print $2}‘ < \"$cache\"`"
139         rval=$?;;
140 ‘BytesPerSec‘)
141         value="`awk ‘/^BytesPerSec:/ {print $2}‘ < \"$cache\"`"
142         rval=$?;;
143 ‘BytesPerReq‘)
144         value="`awk ‘/^BytesPerReq:/ {print $2}‘ < \"$cache\"`"
145         rval=$?;;
146 ‘BusyWorkers‘)
147         value="`awk ‘/^BusyWorkers:/ {print $2}‘ < \"$cache\"`"
148         rval=$?;;
149 ‘IdleWorkers‘)
150         value="`awk ‘/^IdleWorkers:/ {print $2}‘ < \"$cache\"`"
151         rval=$?;;
152 ‘WaitingForConnection‘)
153         value="`awk ‘/^Scoreboard:/ {print split($2,notused,"_")-1}‘ < \"$cache\"`"
154         rval=$?;;
155 ‘StartingUp‘)
156         value="`awk ‘/^Scoreboard:/ {print split($2,notused,"S")-1}‘ < \"$cache\"`"
157         rval=$?;;
158 ‘ReadingRequest‘)
159         value="`awk ‘/^Scoreboard:/ {print split($2,notused,"R")-1}‘ < \"$cache\"`"
160         rval=$?;;
161 ‘SendingReply‘)
162         value="`awk ‘/^Scoreboard:/ {print split($2,notused,"W")-1}‘ < \"$cache\"`"
163         rval=$?;;
164 ‘KeepAlive‘)
165         value="`awk ‘/^Scoreboard:/ {print split($2,notused,"K")-1}‘ < \"$cache\"`"
166         rval=$?;;
167 ‘DNSLookup‘)
168         value="`awk ‘/^Scoreboard:/ {print split($2,notused,"D")-1}‘ < \"$cache\"`"
169         rval=$?;;
170 ‘ClosingConnection‘)
171         value="`awk ‘/^Scoreboard:/ {print split($2,notused,"C")-1}‘ < \"$cache\"`"
172         rval=$?;;
173 ‘Logging‘)
174         value="`awk ‘/^Scoreboard:/ {print split($2,notused,"L")-1}‘ < \"$cache\"`"
175         rval=$?;;
176 ‘GracefullyFinishing‘)
177         value="`awk ‘/^Scoreboard:/ {print split($2,notused,"G")-1}‘ < \"$cache\"`"
178         rval=$?;;
179 ‘IdleCleanupOfWorker‘)
180         value="`awk ‘/^Scoreboard:/ {print split($2,notused,"I")-1}‘ < \"$cache\"`"
181         rval=$?;;
182 ‘OpenSlotWithNoCurrentProcess‘)
183         value="`awk ‘/^Scoreboard:/ {print split($2,notused,".")-1}‘ < \"$cache\"`"
184         rval=$?;;
185 *)
186         usage
187         exit 1;;
188 esa189
190 if [ "$rval" -eq 0 -a -z "$value" ]; then
191     case "$CASE_VALUE" in
192         # Theese metrics are output only if non-zero
193         ‘CPULoad‘ | ‘ReqPerSec‘ | ‘BytesPerSec‘ | ‘BytesPerReq‘)
194             value=0
195             ;;
196         *)
197             rval=1
198             ;;
199     esac
200 fi
201
202 if [ "$rval" -ne 0 ]; then
203         echo "ZBX_NOTSUPPORTED"
204 fi
205
206 echo "$value"
207 exit $rval
(5)将userparameter_zapache.conf配置文件上传至/etc/zabbix/zabbix_agentd.d目录,并重启Zabbix Agent:
[root@web02 zabbix_agentd.d]# vim userparameter_zapache.conf

UserParameter=zapache[*],/scripts/zapache $1
# systemctl restart zabbix-agent
(6)web01节点使用zabbix-get进行取值测试:
# zabbix_get -s 192.168.11.207 -k zapache[ping]
[root@web01 ~]# zabbix_get -s 192.168.11.207 -k zapache[ping]
0
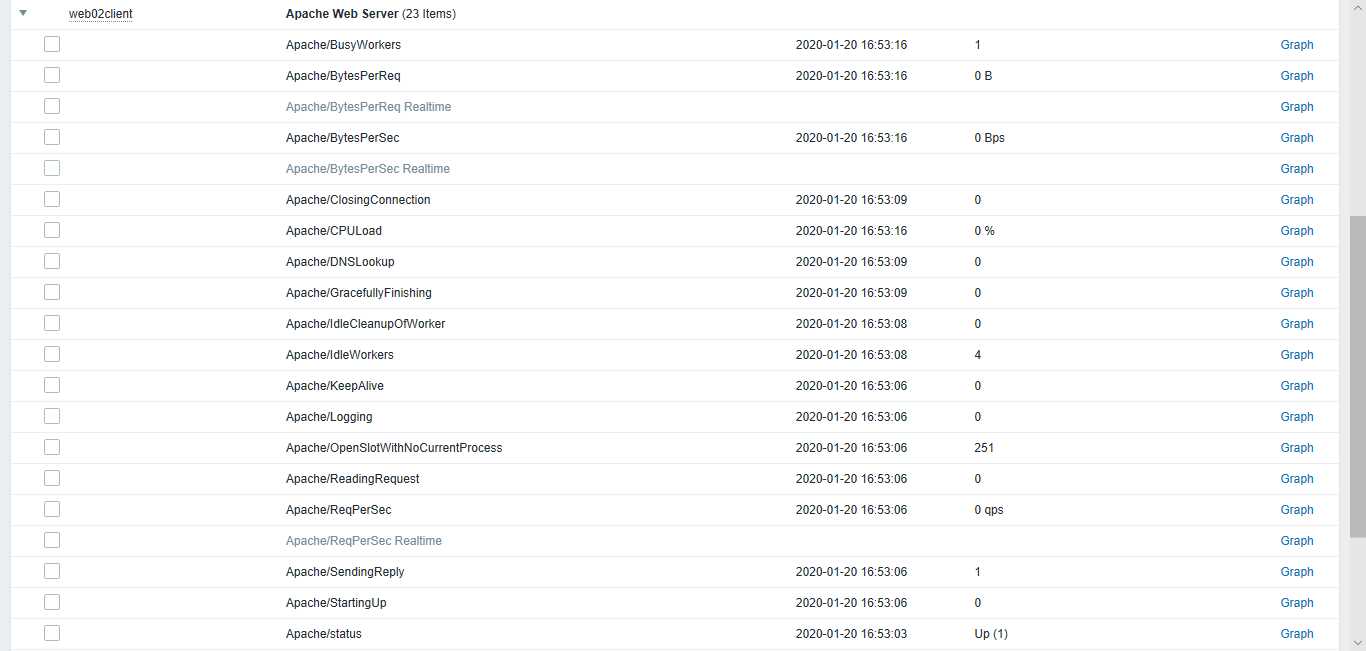
(7)新建监控项目后,自定义模块,加入到监控主机
3、通过JMX监控Tomcat:
(1)web02节点安装JDK和Tomcat
(2)配置Tomcat支持JMX:
# vim /usr/local/tomcat/bin/catalina.sh,在首行#!/bin/sh下方新增如下代码:
CATALINA_OPTS="$CATALINA_OPTS -Djava.rmi.server.hostname=192.168.11.207 -Dcom.sun.management.jmxremote -Dcom.sun.management.jmxremote.port=12345 -Dcom.sun.management.jmxremote.ssl=false -Dcom.sun.management.jmxremote.authenticate=false"
说明:
-Dcom.sun.management.jmxremote:启用远程监控JVM
-Djava.rmi.server.hostname=192.168.11.207:Tomcat的IP地址,而非Zabbix Server的IP地址
-Dcom.sun.management.jmxremote.port=12345:默认启动的JMX端口号
-Dcom.sun.management.jmxremote.ssl=false:不使用SSL认证
-Dcom.sun.management.jmxremote.authenticate=false:不使用用户名密码认证
CATALINA_OPTS和JAVA_OPTS的区别:
CATALINA_OPTS:只被Tomcat使用
JAVA_OPTS:被所有Java应用程序使用
# /usr/local/tomcat/bin/catalina.sh configtest
# /usr/local/tomcat/bin/startup.sh
# ss -tunlp | grep -w :12345
(3)web02节点安装Zabbix Java Gateway:# yum -y install zabbix-java-gateway
(4)web02节点修改zabbix_java_gateway.conf配置文件:
# cd /etc/zabbix
# cp zabbix_java_gateway.conf{,.bak}
# vim zabbix_java_gateway.conf
|
修改前 |
修改后 |
|
# LISTEN_IP="0.0.0.0" |
LISTEN_IP="192.168.0.122" |
|
# LISTEN_PORT=10052 |
LISTEN_PORT=10052 |
|
# START_POLLERS=5 |
START_POLLERS=5 |
|
# TIMEOUT=3 |
TIMEOUT=10 |
(5)web02节点启动Zabbix Java Gateway:
# systemctl start zabbix-java-gateway
# systemctl status zabbix-java-gateway
# ss -tunlp | grep -w :10052
# systemctl enable zabbix-java-gateway
(6)web01节点修改zabbix_server.conf配置文件:
# vim /etc/zabbix/zabbix_server.conf
|
修改前 |
修改后 |
|
# JavaGateway= |
JavaGateway=192.168.0.122 |
|
# JavaGatewayPort=10052 |
JavaGatewayPort=10052 |
|
# StartJavaPollers=0 |
StartJavaPollers=5 |
# systemctl restart zabbix-server
备注:StartJavaPollers的值要小于等于START_POLLERS的值
(7)Zabbix Web添加web02节点的JMX监控接口:
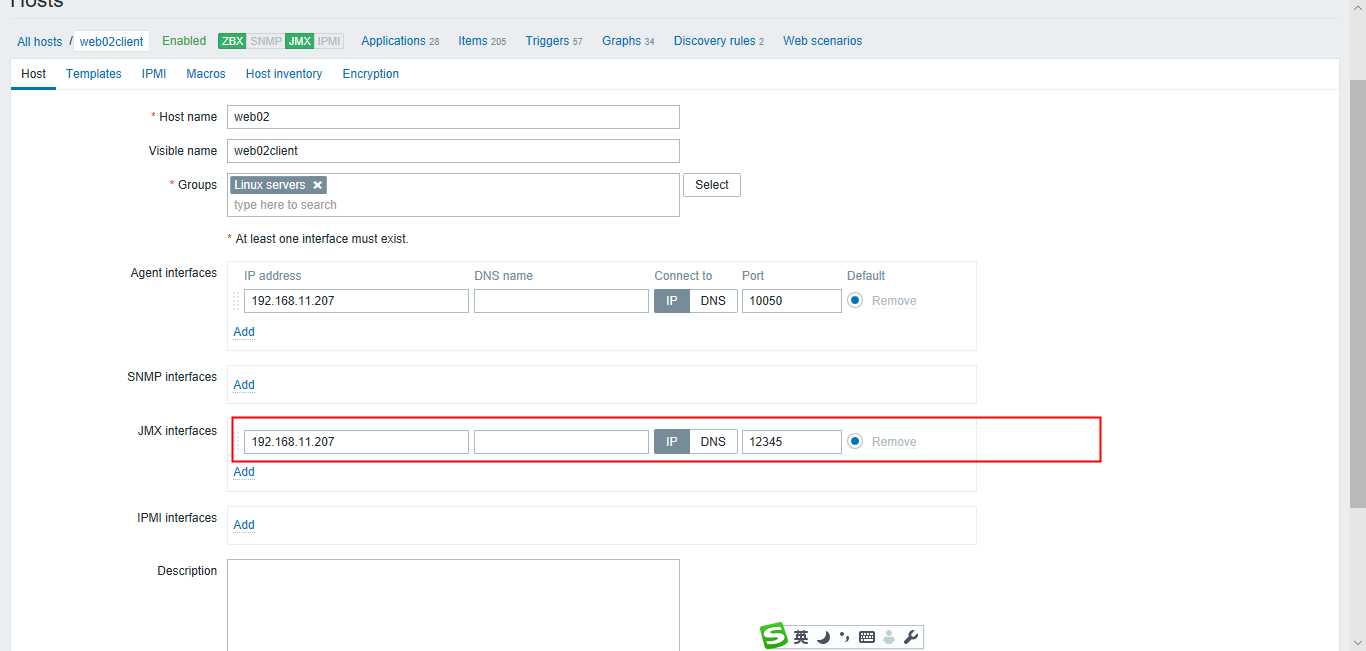
说明:IP为Zabbix Java Gateway所部署服务器的IP,端口为Tomcat中配置的JMX远程端口
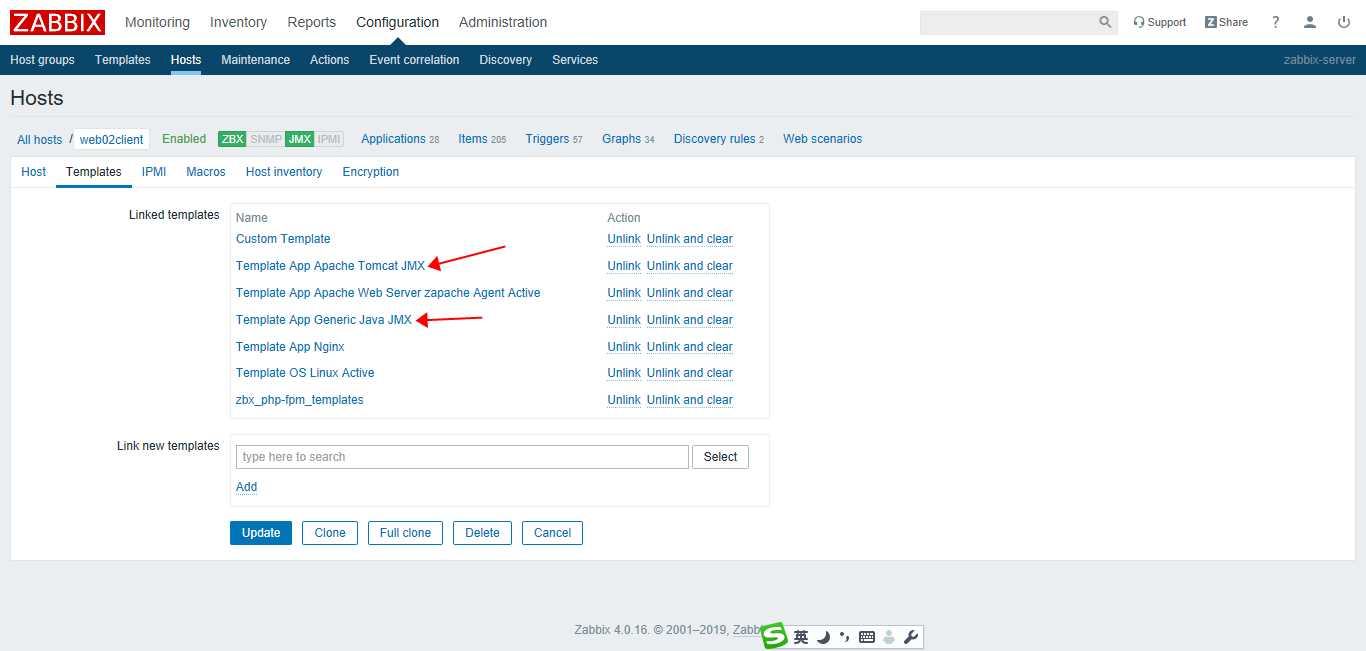
(8)web02节点链接Tomcat监控模板:
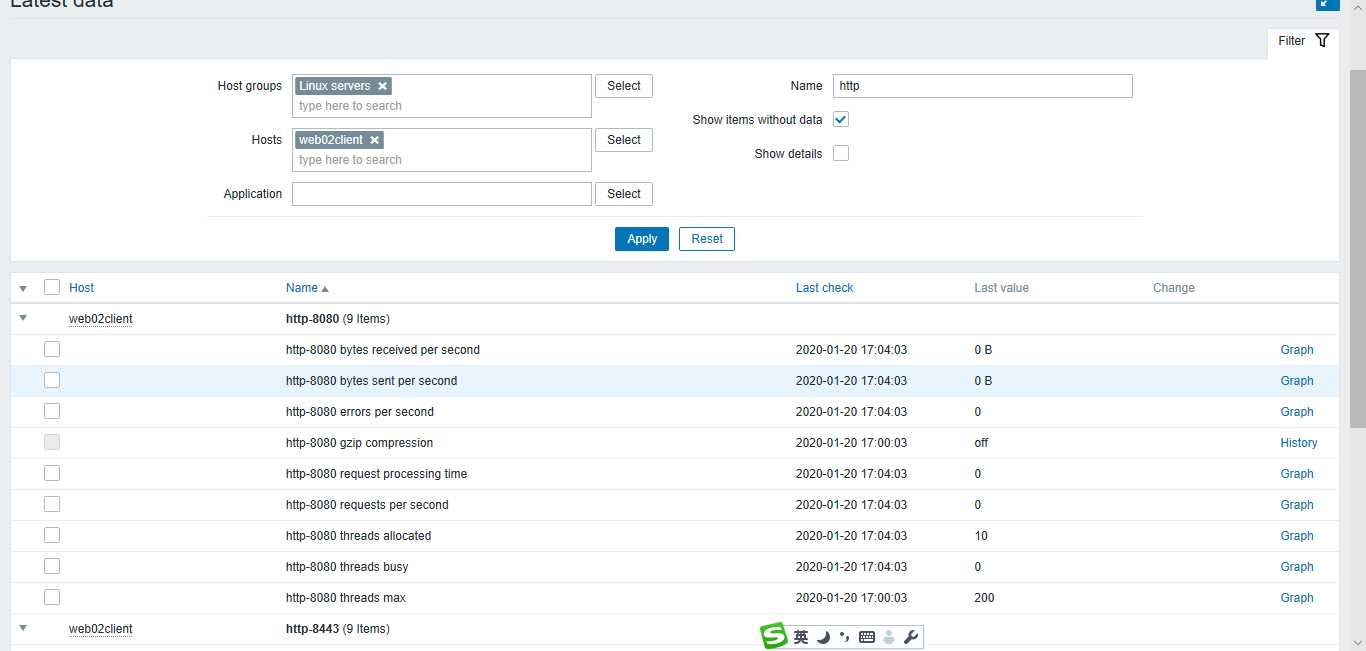
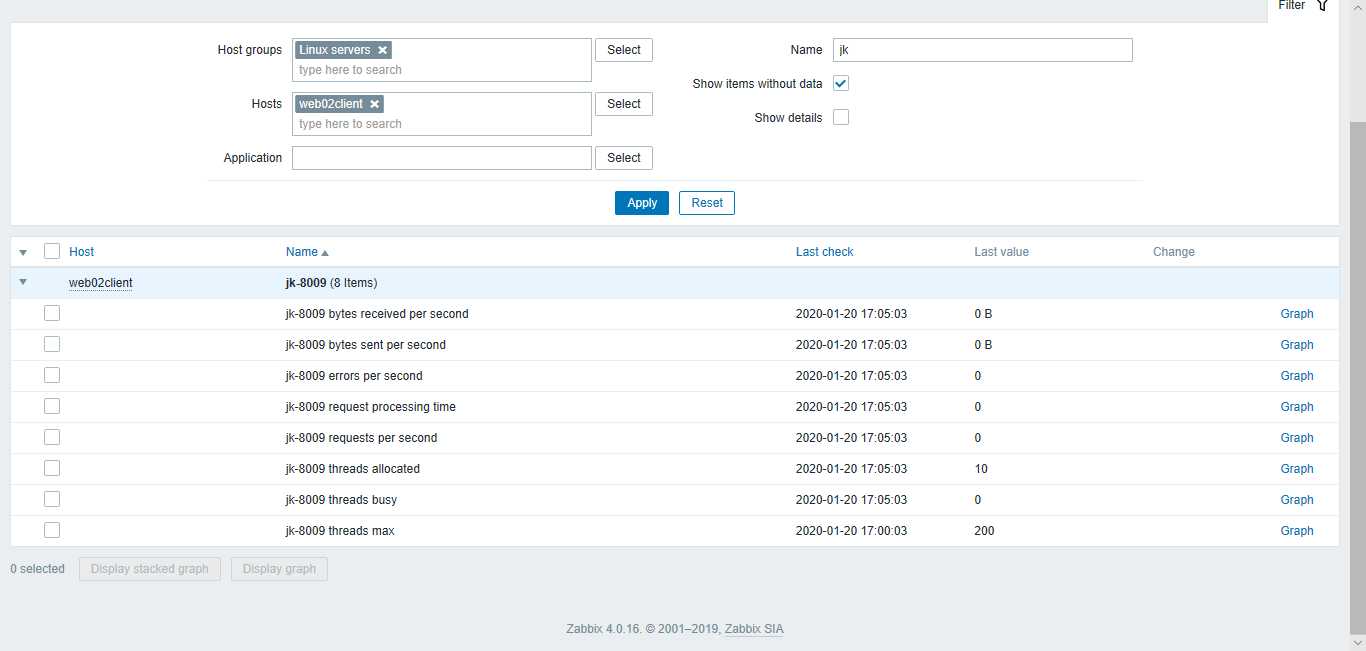
(9)查看最新监控数据:
4、监控php-fpm:
(1)web02节点安装php-fpm
(2)修改www.conf配置文件:
# cd /etc/php-fpm.d
# cp www.conf{,.bak}
# vim www.conf
|
修改前 |
修改后 |
|
user = apache |
user = nginx |
|
group = apache |
group = nginx |
|
;pm.status_path = /status |
pm.status_path = /php-fpm_status |
(3)开启php-fpm状态页面:
# vim /etc/nginx/nginx.conf 在server配置段中新增如下代码:
location / {

root   html;

index  index.php index.html index.htm;

}

location = /php-fpm_status {

fastcgi_pass    127.0.0.1:9000;

fastcgi_index   index.php;

fastcgi_param  SCRIPT_FILENAME  $document_root$fastcgi_script_name;

include        fastcgi_params;

}

# nginx -t
# systemctl restart nginx php-fpm
# ss -tunlp | grep -w :80
# ss -tunlp | grep -w 9000
(4)浏览器访问状态页面:http://192.168.11.207/php-fpm_status
(5)将php-fpm_monitor.sh脚本文件上传至/scripts目录,并赋予执行权限:
  1 #!/bin/bash
  2 PHPFPM_COMMAND=$1
  3 PHPFPM_PORT=80
  4 start_since(){
  5     /usr/bin/curl -s "http://localhost:"$PHPFPM_PORT"/php-fpm_status" |awk ‘/^start since    :/ {print $NF}‘
  6 }
  7 accepted_conn(){
  8     /usr/bin/curl -s "http://localhost:"$PHPFPM_PORT"/php-fpm_status" |awk ‘/^accepted co    nn:/ {print $NF}‘
  9 }
 10 listen_queue(){
 11     /usr/bin/curl -s "http://localhost:"$PHPFPM_PORT"/php-fpm_status" |awk ‘/^listen queu    e:/ {print $NF}‘
 12 }
 13 max_listen_queue(){
 14     /usr/bin/curl -s "http://localhost:"$PHPFPM_PORT"/php-fpm_status" |awk ‘/^max listen     queue:/ {print $NF}‘
 15 }
 16 listen_queue_len(){
 17     /usr/bin/curl -s "http://localhost:"$PHPFPM_PORT"/php-fpm_status" |awk ‘/^listen queu    e len:/ {print $NF}‘
 18 }
 19 idle_processes(){
 20     /usr/bin/curl -s "http://localhost:"$PHPFPM_PORT"/php-fpm_status" |awk ‘/^idle proces    ses:/ {print $NF}‘
 21 }
 22 active_processes(){
 23     /usr/bin/curl -s "http://localhost:"$PHPFPM_PORT"/php-fpm_status" |awk ‘/^active proc    esses:/ {print $NF}‘
 24 }
 25 total_processes(){
26     /usr/bin/curl -s "http://localhost:"$PHPFPM_PORT"/php-fpm_status" |awk ‘/^total proce    sses:/ {print $NF}‘
 27 }
 28 max_active_processes(){
 29     /usr/bin/curl -s "http://localhost:"$PHPFPM_PORT"/php-fpm_status" |awk ‘/^max active     processes:/ {print $NF}‘
 30 }
 31 max_children_reached(){
 32     /usr/bin/curl -s "http://localhost:"$PHPFPM_PORT"/php-fpm_status" |awk ‘/^max childre    n reached:/ {print $NF}‘
 33 }
 34 slow_requests(){
 35     /usr/bin/curl -s "http://localhost:"$PHPFPM_PORT"/php-fpm_status" |awk ‘/^slow reques    ts:/ {print $NF}‘
 36 }
 37
 38 case $PHPFPM_COMMAND in
 39     start_since)
 40             start_since;
 41             ;;
 42     accepted_conn)
 43             accepted_conn;
 44             ;;
 45     listen_queue)
 46             listen_queue;
 47             ;;
 48     max_listen_queue)
 49             max_listen_queue;
 50             ;;
 51     listen_queue_len)
 52             listen_queue_len;
 53             ;;
 54     idle_processes)
 55             idle_processes;
 56             ;;
 57     active_processes)
 58             active_processes;
 59             ;;
 60         total_processes)
 61                 total_processes;
 62                 ;;
 63         max_active_processes)
 64                 max_active_processes;
 65                 ;;
 66         max_children_reached)
 67                 max_children_reached;
 68                 ;;
 69         slow_requests)
 70                 slow_requests;
 71                 ;;
 72     *)
 73             echo $"USAGE:$0 {start_since|accepted_conn|listen_queue|max_listen_queue|list    en_queue_len|idle_processes|active_processes|total_processes|max_active_processes|max_chi    ldren_reached}"
 74 esac
# chmod +x /scripts/php-fpm_monitor.sh
(6)将php-fpm_status.conf配置文件上传至/etc/zabbix/zabbix_agentd.d目录,并重启Zabbix Agent:
[root@web02 zabbix_agentd.d]# vim php-fpm_status.conf

UserParameter=php-fpm_status[*],/scripts/php-fpm_monitor.sh "$1"
# systemctl restart zabbix-agent
(7)zabbix-server节点使用zabbix-get进行取值测试:
[root@web01 ~]# zabbix_get -s 192.168.11.207 -k php-fpm_status[accepted_conn]
[root@web01 ~]# zabbix_get -s 192.168.11.207 -k php-fpm_status[active_processes]
(8)新建监控项目后,自定义模块,加入到监控主机
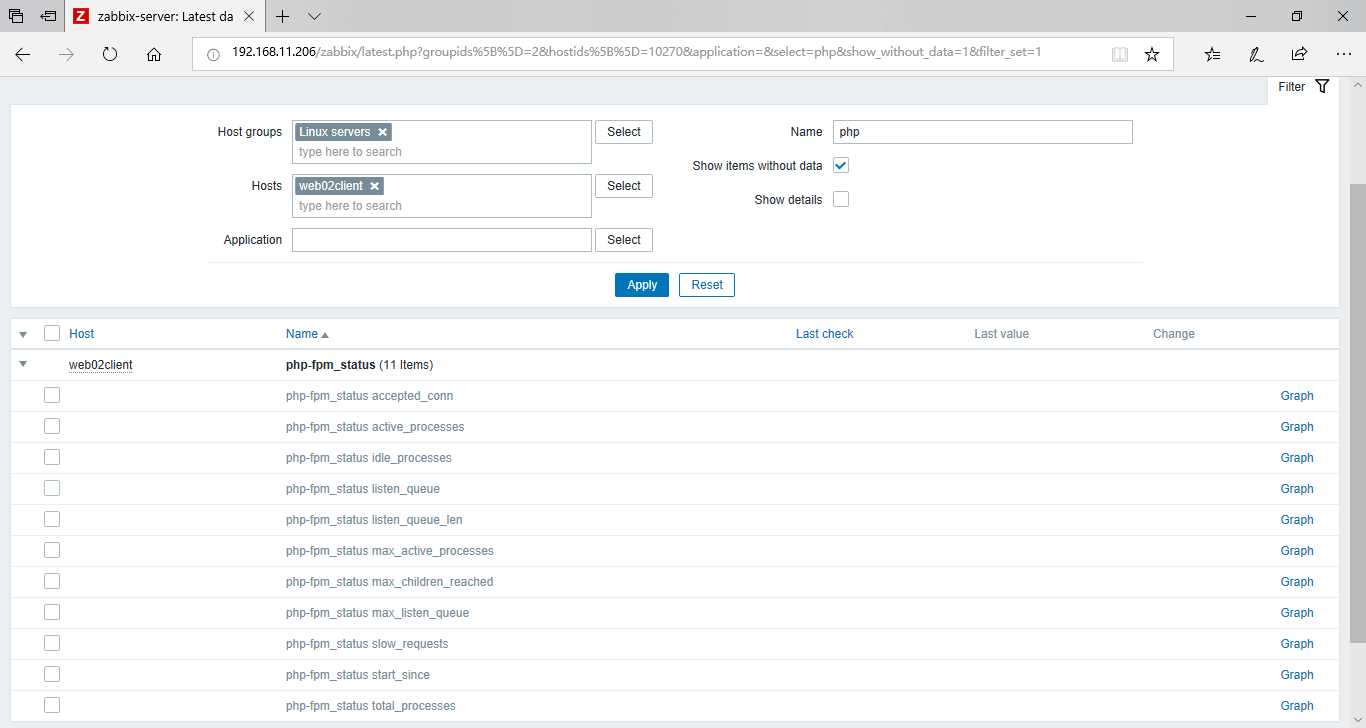
(9)查看最新监控数据:
5、监控Redis:
(1)web02节点安装Redis
(2)查看Redis状态信息:
# redis-cli info
[root@web02 zabbix_agentd.d]# redis-cli info
# Server
redis_version:3.2.12
redis_git_sha1:00000000
redis_git_dirty:0
redis_build_id:7897e7d0e13773f
redis_mode:standalone
os:Linux 3.10.0-957.el7.x86_64 x86_64
arch_bits:64
multiplexing_api:epoll
gcc_version:4.8.5
process_id:109212
run_id:09744ad87afcfbcbe344de36e24f7b4e434d5c12
tcp_port:6379
uptime_in_seconds:2
uptime_in_days:0
hz:10
lru_clock:2453912
executable:/usr/bin/redis-server
config_file:/etc/redis.conf
# Clients
connected_clients:1
client_longest_output_list:0
client_biggest_input_buf:0
blocked_clients:0
# Memory
used_memory:813448
used_memory_human:794.38K
used_memory_rss:5922816
used_memory_rss_human:5.65M
used_memory_peak:813448
used_memory_peak_human:794.38K
total_system_memory:1907941376
total_system_memory_human:1.78G
used_memory_lua:37888
used_memory_lua_human:37.00K
maxmemory:0
maxmemory_human:0B
maxmemory_policy:noeviction
mem_fragmentation_ratio:7.28
mem_allocator:jemalloc-3.6.0
# Persistence
loading:0
rdb_changes_since_last_save:0
rdb_bgsave_in_progress:0
rdb_last_save_time:1579512214
rdb_last_bgsave_status:ok
rdb_last_bgsave_time_sec:-1
rdb_current_bgsave_time_sec:-1
aof_enabled:0
aof_rewrite_in_progress:0
aof_rewrite_scheduled:0
aof_last_rewrite_time_sec:-1
aof_current_rewrite_time_sec:-1
aof_last_bgrewrite_status:ok
aof_last_write_status:ok
# Stats
total_connections_received:1
total_commands_processed:0
instantaneous_ops_per_sec:0
total_net_input_bytes:14
total_net_output_bytes:0
instantaneous_input_kbps:0.00
instantaneous_output_kbps:0.00
rejected_connections:0
sync_full:0
sync_partial_ok:0
sync_partial_err:0
expired_keys:0
evicted_keys:0
keyspace_hits:0
keyspace_misses:0
pubsub_channels:0
pubsub_patterns:0
latest_fork_usec:0
migrate_cached_sockets:0
# Replication
role:master
connected_slaves:0
master_repl_offset:0
repl_backlog_active:0
repl_backlog_size:1048576
repl_backlog_first_byte_offset:0
repl_backlog_histlen:0
# CPU
used_cpu_sys:0.01
used_cpu_user:0.00
used_cpu_sys_children:0.00
used_cpu_user_children:0.00
# Cluster
cluster_enabled:0
# Keyspace
(3)将redis_monitor.sh脚本文件上传至/scripts目录,并赋予执行权限:# chmod +x /scripts/redis_monitor.sh
  1 #!/bin/bash
  2 REDISCLI="/usr/bin/redis-cli"
  3 HOST="127.0.0.1"
  4 PORT=6379
  5 PASS=""
  6
  7 if [[ $# == 1 ]];then
  8     case $1 in
  9         version)
 10             result=`$REDISCLI -h $HOST -a $PASS -p $PORT info server | grep -w "redis_ver    sion" | awk -F‘:‘ ‘{print $2}‘`
 11             echo $result
 12         ;;
 13         uptime)
 14             result=`$REDISCLI -h $HOST -a $PASS -p $PORT info server | grep -w "uptime_in    _seconds" | awk -F‘:‘ ‘{print $2}‘`
 15             echo $result
 16         ;;
 17         connected_clients)
 18             result=`$REDISCLI -h $HOST -a $PASS -p $PORT info clients | grep -w "connecte    d_clients" | awk -F‘:‘ ‘{print $2}‘`
 19             echo $result
 20         ;;
 21         blocked_clients)
 22             result=`$REDISCLI -h $HOST -a $PASS -p $PORT info clients | grep -w "blocked_    clients" | awk -F‘:‘ ‘{print $2}‘`
 23             echo $result
 24         ;;
 25         used_memory)
 26             result=`$REDISCLI -h $HOST -a $PASS -p $PORT info memory | grep -w "used_memo    ry" | awk -F‘:‘ ‘{print $2}‘`
 27             echo $result
 28         ;;
 29         used_memory_rss)
 30             result=`$REDISCLI -h $HOST -a $PASS -p $PORT info memory | grep -w "used_memo    ry_rss" | awk -F‘:‘ ‘{print $2}‘`
 31             echo $result
 32         ;;
 33         used_memory_peak)
 34             result=`$REDISCLI -h $HOST -a $PASS -p $PORT info memory | grep -w "used_memo    ry_peak" | awk -F‘:‘ ‘{print $2}‘`
 35             echo $result
 36         ;;
 37         used_memory_lua)
 38             result=`$REDISCLI -h $HOST -a $PASS -p $PORT info memory | grep -w "used_memo    ry_lua" | awk -F‘:‘ ‘{print $2}‘`
 39             echo $result
 40         ;;
 41         used_cpu_sys)
 42             result=`$REDISCLI -h $HOST -a $PASS -p $PORT info cpu | grep -w "used_cpu_sys    " | awk -F‘:‘ ‘{print $2}‘`
 43             echo $result
 44         ;;
 45         used_cpu_user)
 46             result=`$REDISCLI -h $HOST -a $PASS -p $PORT info cpu | grep -w "used_cpu_use    r" | awk -F‘:‘ ‘{print $2}‘`
 47             echo $result
 48         ;;
 49         used_cpu_sys_children)
 50             result=`$REDISCLI -h $HOST -a $PASS -p $PORT info cpu | grep -w "used_cpu_sys    _children" | awk -F‘:‘ ‘{print $2}‘`
 51             echo $result
 52         ;;
 53         used_cpu_user_children)
 54             result=`$REDISCLI -h $HOST -a $PASS -p $PORT info cpu | grep -w "used_cpu_use    r_children" | awk -F‘:‘ ‘{print $2}‘`
 55             echo $result
 56         ;;
 57         rdb_last_bgsave_status)
 58             result=`$REDISCLI -h $HOST -a $PASS -p $PORT info Persistence | grep -w "rdb_    last_bgsave_status" | awk -F‘:‘ ‘{print $2}‘ | grep -c ok`
 59             echo $result
 60         ;;
 61         aof_last_bgrewrite_status)
 62             result=`$REDISCLI -h $HOST -a $PASS -p $PORT info Persistence | grep -w "aof_    last_bgrewrite_status" | awk -F‘:‘ ‘{print $2}‘ | grep -c ok`
 63             echo $result
 64         ;;
 65         aof_last_write_status)
 66             result=`$REDISCLI -h $HOST -a $PASS -p $PORT info Persistence | grep -w "aof_    last_write_status" | awk -F‘:‘ ‘{print $2}‘ | grep -c ok`
 67             echo $result
 68         ;;
 69         *)
 70             echo -e "\033[33mUsage: $0 {connected_clients|blocked_clients|used_memory|use    d_memory_rss|used_memory_peak|used_memory_lua|used_cpu_sys|used_cpu_user|used_cpu_sys_chi    ldren|used_cpu_user_children|rdb_last_bgsave_status|aof_last_bgrewrite_status|aof_last_wr    ite_status}\033[0m"
 71         ;;
 72     esac
 73 elif [[ $# == 2 ]];then
 74     case $2 in
 75         keys)
 76             result=`$REDISCLI -h $HOST -a $PASS -p $PORT info | grep -w "$1" | grep -w "k    eys" | awk -F‘=|,‘ ‘{print $2}‘`
 77             echo $result
78         ;;
 79         expires)
 80             result=`$REDISCLI -h $HOST -a $PASS -p $PORT info | grep -w "$1" | grep -w "k    eys" | awk -F‘=|,‘ ‘{print $4}‘`
 81             echo $result
 82         ;;
 83         avg_ttl)
 84             result=`$REDISCLI -h $HOST -a $PASS -p $PORT info | grep -w "$1" | grep -w "a    vg_ttl" | awk -F‘=|,‘ ‘{print $6}‘`
 85             echo $result
 86         ;;
 87         *)
 88             echo -e "\033[33mUsage: $0 {db0 keys|db0 expires|db0 avg_ttl}\033[0m"
 89         ;;
 90     esac
 91 fi
(4)将redis_status.conf配置文件上传至/etc/zabbix/zabbix_agentd.d目录,并重启Zabbix Agent:
[root@web02 zabbix_agentd.d]# vim redis_status.conf

UserParameter=redis_status[*],/scripts/redis_monitor.sh $1 $2
# systemctl restart zabbix-agent
(5)zabbix-server节点使用zabbix-get进行取值测试:
# zabbix_get -s 192.168.11.207 -k redis
标签:include one UNC pidof location null ams mem repo
原文地址:https://www.cnblogs.com/comprehensive/p/12218503.html
