标签:res name vsc asi category false ali echarts img
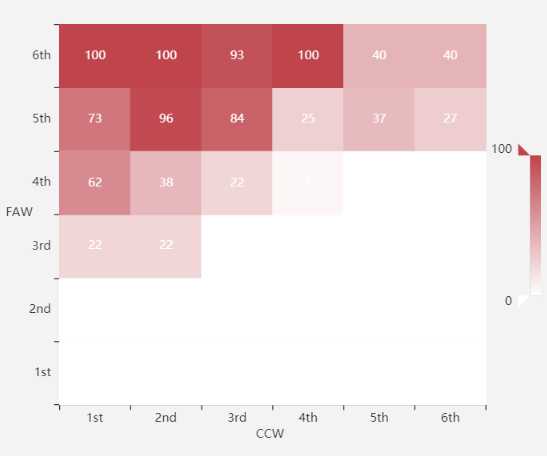
废话不多说,直接上图,表示了两种不同物种之间随年龄增长竞争关系。
https://www.echartsjs.com/examples/zh/editor.html?c=heatmap-cartesian
代码如下:
var faw = [‘1st‘, ‘2nd‘, ‘3rd‘,
        ‘4th‘, ‘5th‘, ‘6th‘];
var ccb = [‘1st‘, ‘2nd‘, ‘3rd‘,
        ‘4th‘, ‘5th‘, ‘6th‘];

var data = [[0,0,0],[0,1,0],[0,2,0],[0,3,0],[0,4,0],[0,5,0],
[1,0,0],[1,1,0],[1,2,0],[1,3,0],[1,4,0],[1,5,0],
[2,0,22],[2,1,22],[2,2,0],[2,3,0],[2,4,0],[2,5,0],
[3,0,62],[3,1,38],[3,2,22],[3,3,5],[3,4,0],[3,5,0],
[4,0,73],[4,1,96],[4,2,84],[4,3,25],[4,4,37],[4,5,27],
[5,0,100],[5,1,100],[5,2,93],[5,3,100],[5,4,40],[5,5,40]

];

data = data.map(function (item) {
    return [item[1], item[0], item[2]];
});

option = {
    tooltip: {
        position: ‘top‘
    },
    toolbox: {
        feature: {
            dataZoom: {
                yAxisIndex: ‘none‘
            },
            restore: {},
            saveAsImage: {}
        }
    },
    animation: false,
    grid: {
        height: ‘50%‘,
        left: ‘13%‘,
        top: ‘20%‘,

        //backgroundColor:‘white‘
    },
    xAxis: {
        name:‘CCW‘,
         nameTextStyle: {
            padding: [0, 0, -60, -245]    // 四个数字分别为上右下左与原位置距离
        },
        type: ‘category‘,
        data: ccb,
        splitArea: {
            show: true
        }
    },
    yAxis: {
        name:‘FAW‘,
        nameTextStyle: {
            padding: [0, 0, -210, -80]    // 四个数字分别为上右下左与原位置距离
        },
        type: ‘category‘,
        data: faw,
        splitArea: {
            show: true
        }
    },
    visualMap: {
        min: 0,
        max: 100,
        // align: ‘left‘,
        calculable: true,
        orient: ‘vertical‘,
        left: ‘90%‘,
        top: ‘35%‘,
        // top: ‘auto‘,
        //right: ‘10%‘,
        inRange: {
                color: [‘white‘,‘rgb(191,68,76)‘]
            }
    },
    series: [{
        name: ‘fawVSccb‘,
        type: ‘heatmap‘,
        data: data,
        label: {
            show : true,
            color:‘white‘
        },
        emphasis: {
            itemStyle: {
                shadowBlur: 10,
                shadowColor: ‘white‘
            },
        }
    }]
};
标签:res name vsc asi category false ali echarts img
原文地址:https://www.cnblogs.com/marszhw/p/12290019.html