标签:实践 运动鞋 ast block 包括 相加 symbol 迭代 假设
理论部分:
分类问题
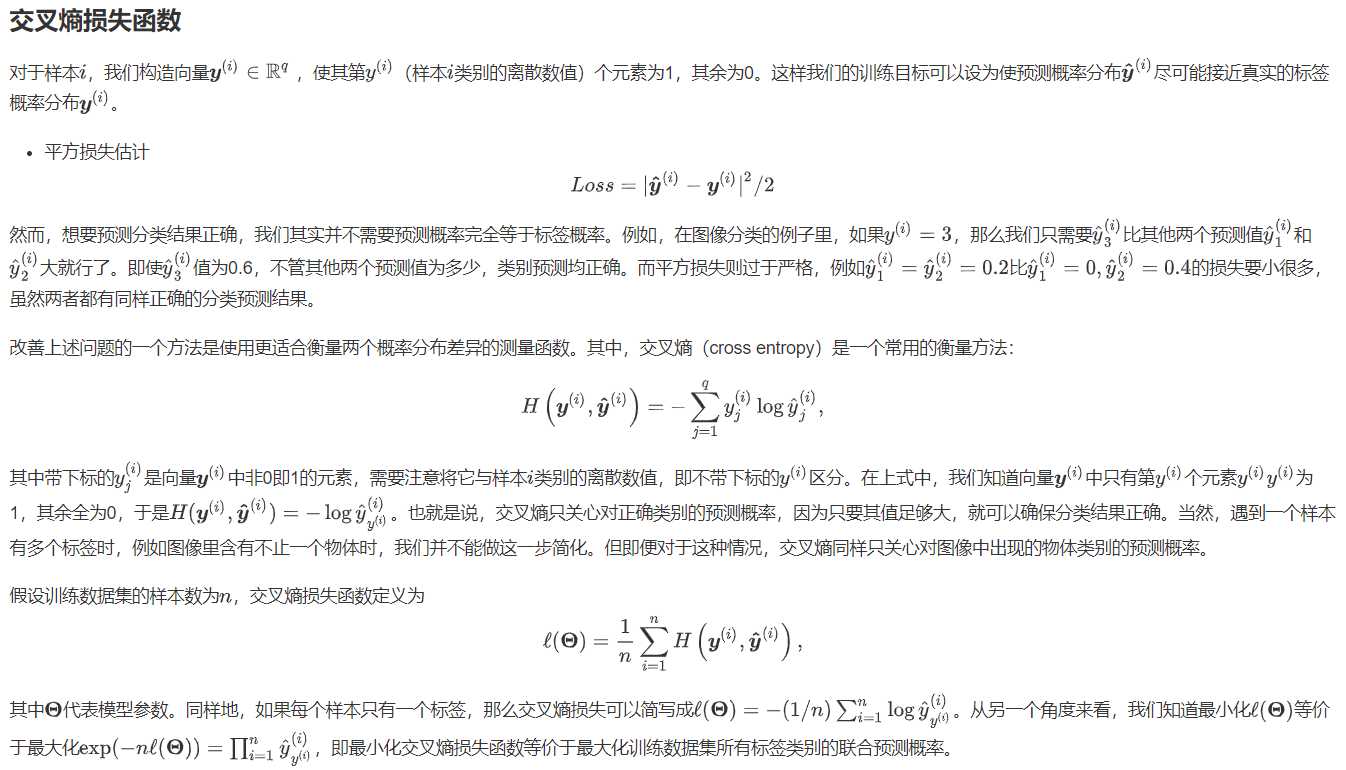
一个简单的图像分类问题,输入图像的高和宽均为2像素,色彩为灰度。
图像中的4像素分别记为x1,x2,x3,x4。
假设真实标签为狗、猫或者鸡,这些标签对应的离散值为y1,y2,y3。
我们通常使用离散的数值来表示类别,例如y1=1,y2=2,y3=3。
权重矢量
o2=x1w12+x2w22+x3w32+x4w42+b2
o3=x1w13+x2w23+x3w33+x4w43+b3

既然分类问题需要得到离散的预测输出,一个简单的办法是将输出值oi当作预测类别是i的置信度,并将值最大的输出所对应的类作为预测输出,即输出 arg?maxioi。例如,如果o1,o2,o3分别为0.1,10,0.1,由于o2最大,那么预测类别为2,其代表猫。
softmax运算符(softmax operator)解决了以上两个问题。它通过下式将输出值变换成值为正且和为1的概率分布:
其中
容易看出y^1+y^2+y^3=1且0≤y^1,y^2,y^3≤1,因此y^1,y^2,y^3是一个合法的概率分布。这时候,如果y^2=0.8,不管y^1和y^3的值是多少,我们都知道图像类别为猫的概率是80%。此外,我们注意到
因此softmax运算不改变预测类别输出。

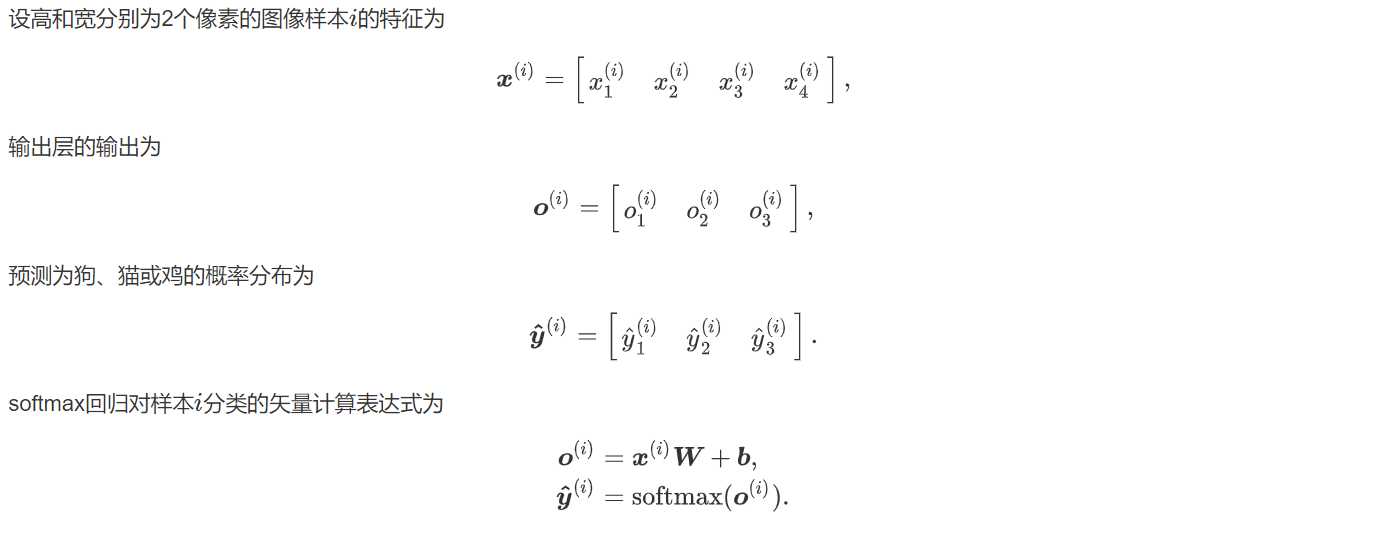
其中的加法运算使用了广播机制,O,Y^∈Rn×q且这两个矩阵的第i行分别为样本i的输出o(i)和概率分布y^(i)。
#广播机制
定义:当两个数组的形状并不相同的时候,我们可以通过扩展数组的方法来实现相加、相减、相乘等操作,这种机制叫做广播(broadcasting)
原则:如果两个数组的后缘维度(trailing dimension,即从末尾开始算起的维度)的轴长度相符,或其中的一方的长度为1,则认为它们是广播兼容的。广播会在缺失和(或)长度为1的维度上进行。
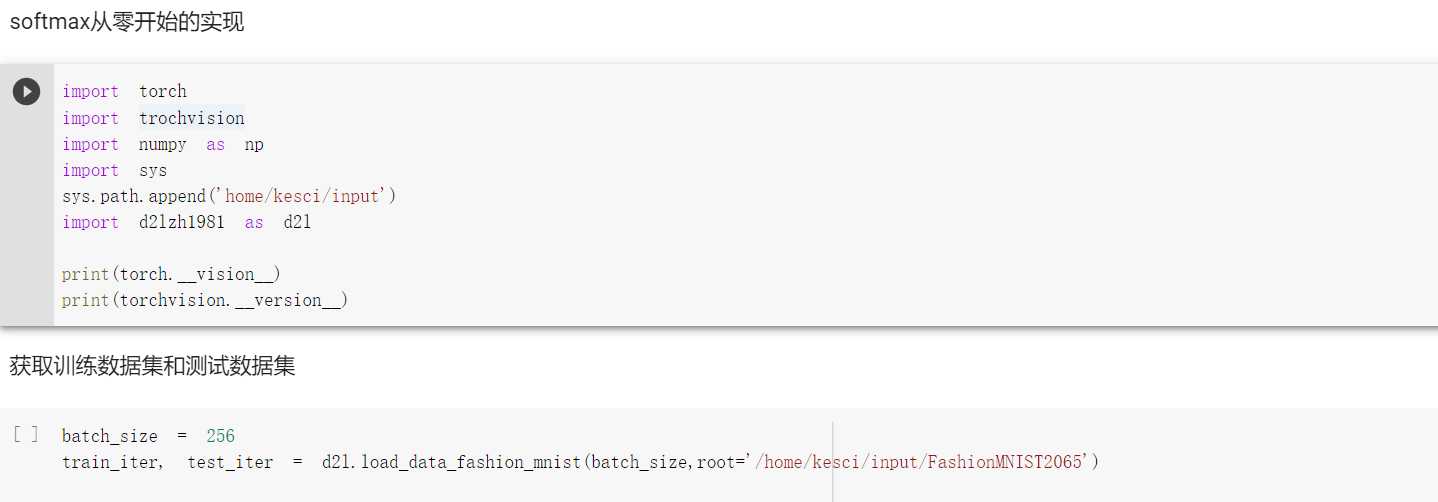
在训练好softmax回归模型后,给定任一样本特征,就可以预测每个输出类别的概率。通常,我们把预测概率最大的类别作为输出类别。如果它与真实类别(标签)一致,说明这次预测是正确的。在3.6节的实验中,我们将使用准确率(accuracy)来评价模型的表现。它等于正确预测数量与总预测数量之比。
实践部分:
softmax从0开始
https://colab.research.google.com/drive/1a4ME-GOpB98uR-PYRa-774P9utKW-RLw
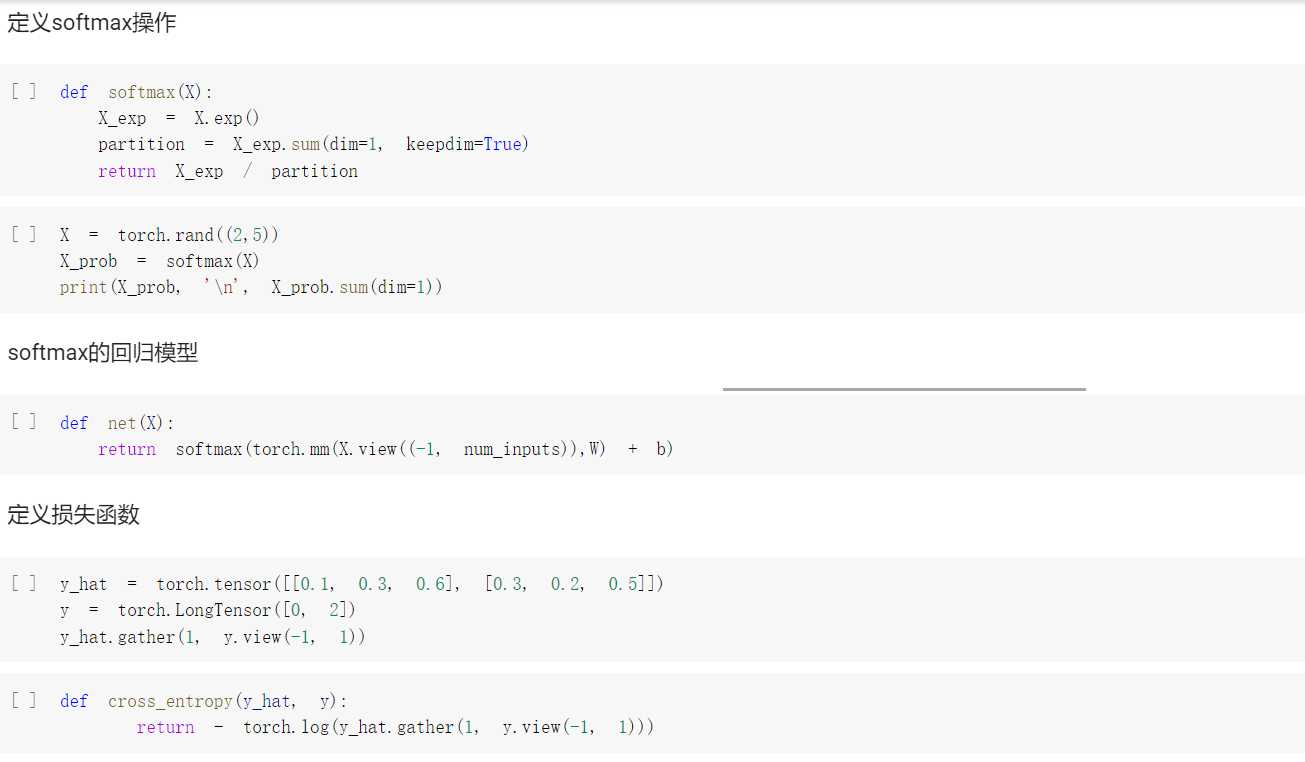
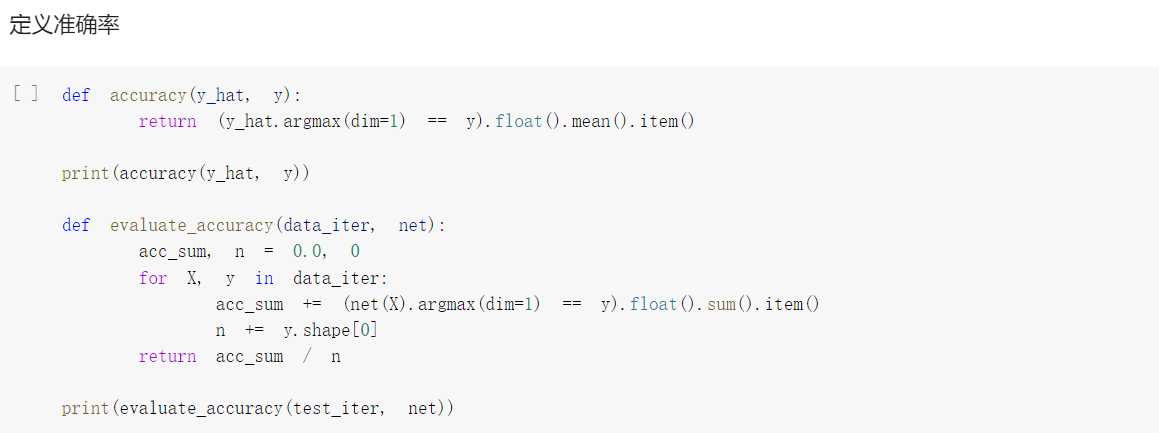
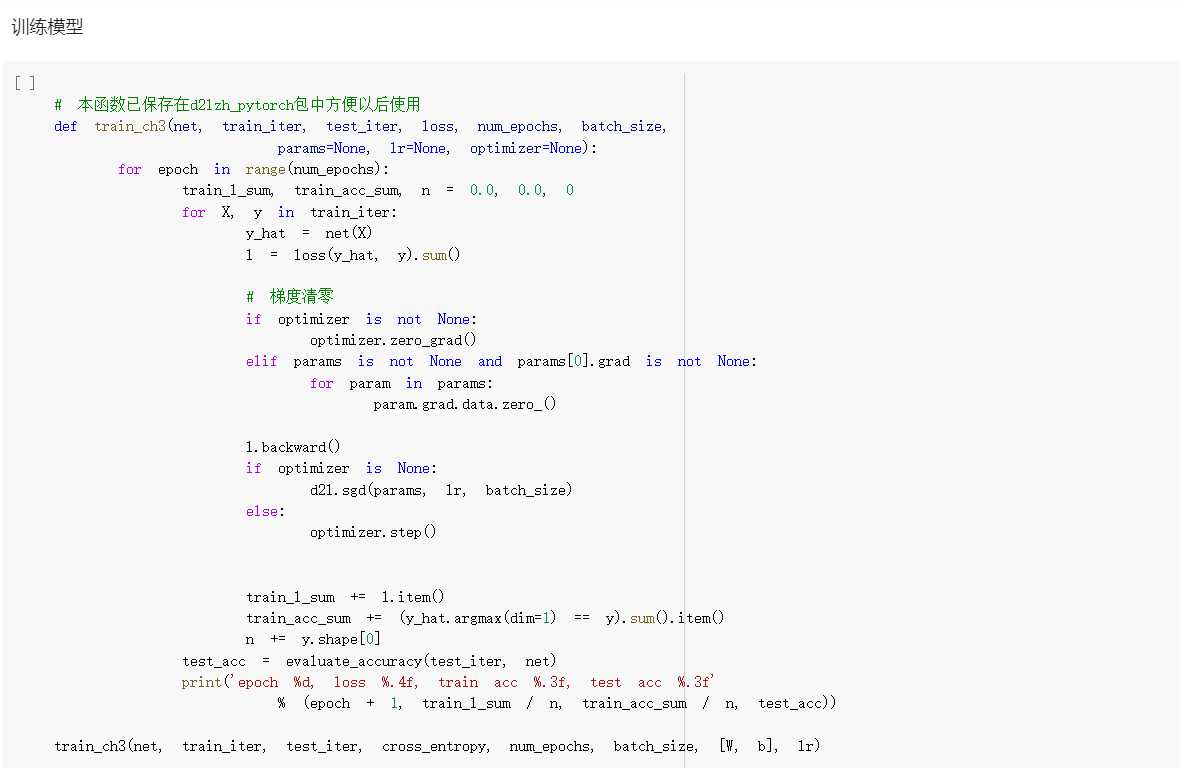

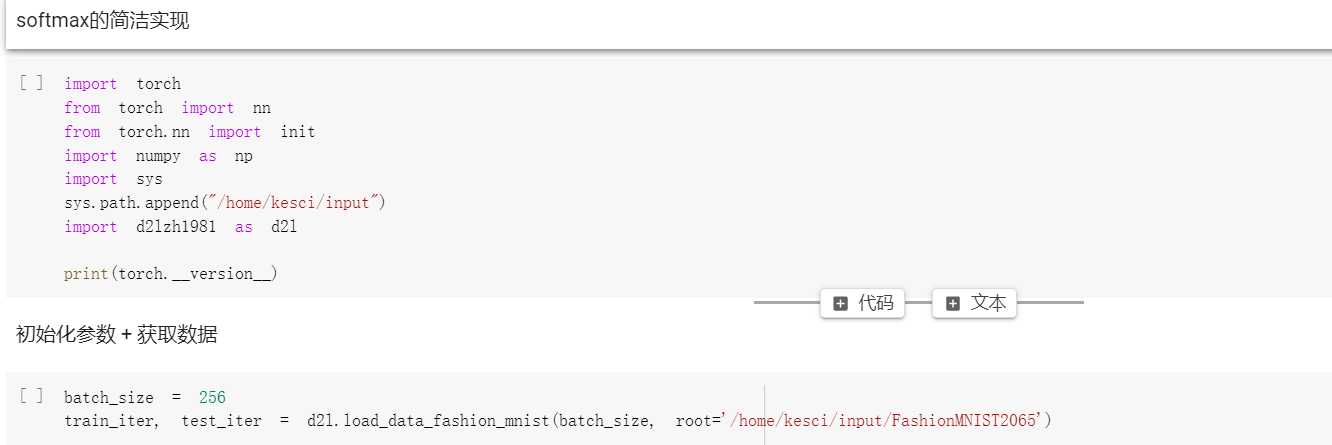
softmax简单实现
https://colab.research.google.com/drive/14BNFgHEytYGtqiLeOwgNldkicxw_LtBt
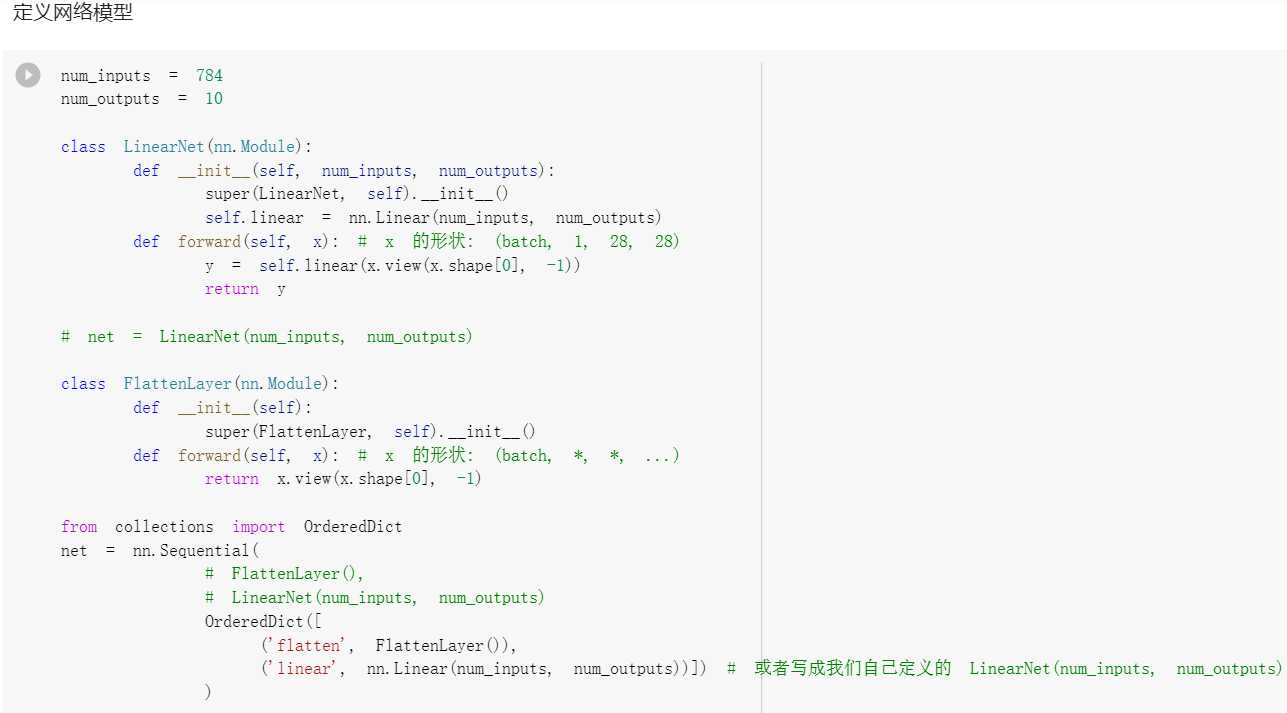
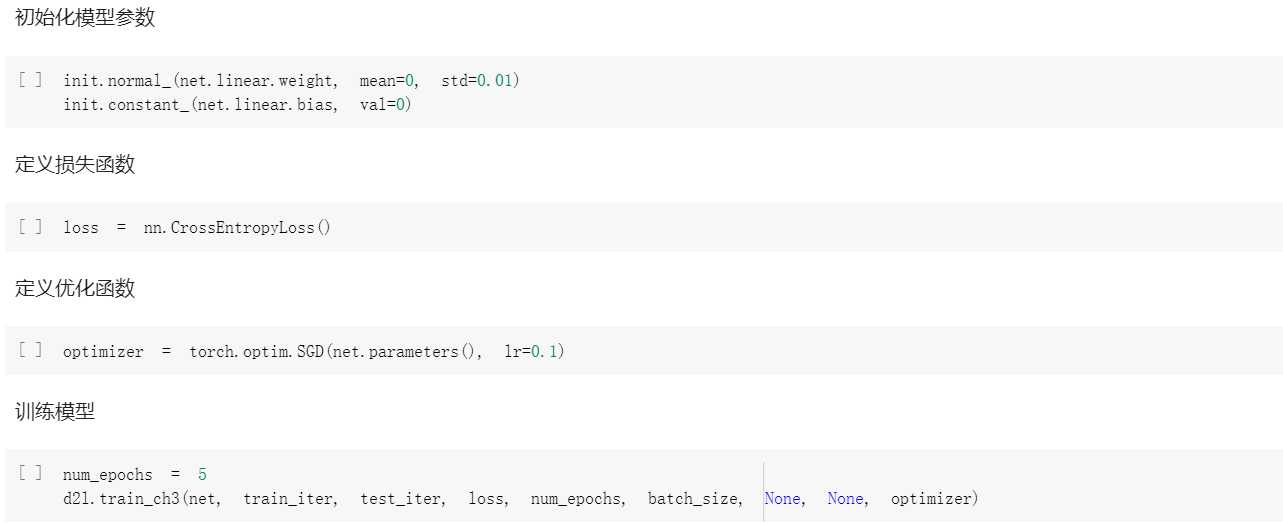
#!/usr/bin/env python# coding: utf-8
# In[36]:
get_ipython().run_line_magic(‘matplotlib‘, ‘inline‘)import d2lzh as d2lfrom mxnet.gluon import data as gdataimport sysimport timefrom mxnet import autograd, nd
# 通过Gluon的data包来下载这个数据集。第一次调用时会自动从网上获取数据。我们通过参数train来指定获取训练数据集或测试数据集(testing data set)。测试数据集也叫测试集(testing set),只用来评价模型的表现,并不用来训练模型。
# In[7]:
mnist_train = gdata.vision.FashionMNIST(train=True)mnist_test = gdata.vision.FashionMNIST(train=False)
# In[8]:
# show result print(type(mnist_train))print(len(mnist_train), len(mnist_test))
# 变量feature对应高和宽均为28像素的图像。每个像素的数值为0到255之间8位无符号整数(uint8)。它使用三维的NDArray存储。其中的最后一维是通道数。因为数据集中是灰度图像,所以通道数为1。为了表述简洁,我们将高和宽分别为 h 和 w 像素的图像的形状记为 h*w 或(h,w)。
# In[10]:
# 我们可以通过下标来访问任意一个样本feature, label = mnist_train[0]print(feature.shape, feature.dtype) # Height x Width x Channel
# 图像的标签使用NumPy的标量表示。它的类型为32位整数(int32)。
# In[11]:
print(label, type(label), label.dtype)
# Fashion-MNIST中一共包括了10个类别,分别为t-shirt(T恤)、trouser(裤子)、pullover(套衫)、dress(连衣裙)、coat(外套)、sandal(凉鞋)、shirt(衬衫)、sneaker(运动鞋)、bag(包)和ankle boot(短靴)。以下函数可以将数值标签转成相应的文本标签。
# In[12]:
# 本函数已保存在d2lzh包中方便以后使用def get_fashion_mnist_labels(labels): text_labels = [‘t-shirt‘, ‘trouser‘, ‘pullover‘, ‘dress‘, ‘coat‘, ‘sandal‘, ‘shirt‘, ‘sneaker‘, ‘bag‘, ‘ankle boot‘] return [text_labels[int(i)] for i in labels]
# In[13]:
# 本函数已保存在d2lzh包中方便以后使用def show_fashion_mnist(images, labels): d2l.use_svg_display() # 这里的_表示我们忽略(不使用)的变量 _, figs = d2l.plt.subplots(1, len(images), figsize=(12, 12)) for f, img, lbl in zip(figs, images, labels): f.imshow(img.reshape((28, 28)).asnumpy()) f.set_title(lbl) f.axes.get_xaxis().set_visible(False) f.axes.get_yaxis().set_visible(False)
# 看一下训练数据集中前9个样本的图像内容和文本标签。
# In[14]:
X, y = mnist_train[0:9]show_fashion_mnist(X, get_fashion_mnist_labels(y))
# In[15]:
batch_size = 256transformer = gdata.vision.transforms.ToTensor()if sys.platform.startswith(‘win‘): num_workers = 0 # 0表示不用额外的进程来加速读取数据else: num_workers = 4
train_iter = gdata.DataLoader(mnist_train.transform_first(transformer), batch_size, shuffle=True, num_workers=num_workers)test_iter = gdata.DataLoader(mnist_test.transform_first(transformer), batch_size, shuffle=False, num_workers=num_workers)
# In[16]:
start = time.time()for X, y in train_iter: continue‘%.2f sec‘ % (time.time() - start)
# ### 初始化参数和获取数据
# In[31]:
#读取数据batch_size = 256train_iter, test_iter = d2l.load_data_fashion_mnist(batch_size)
# In[45]:
num_inputs = 784num_outputs = 10
W = nd.random.normal(scale=0.01, shape=(num_inputs, num_outputs))b = nd.zeros(num_outputs)
# In[46]:
W.attach_grad()b.attach_grad()
# In[47]:
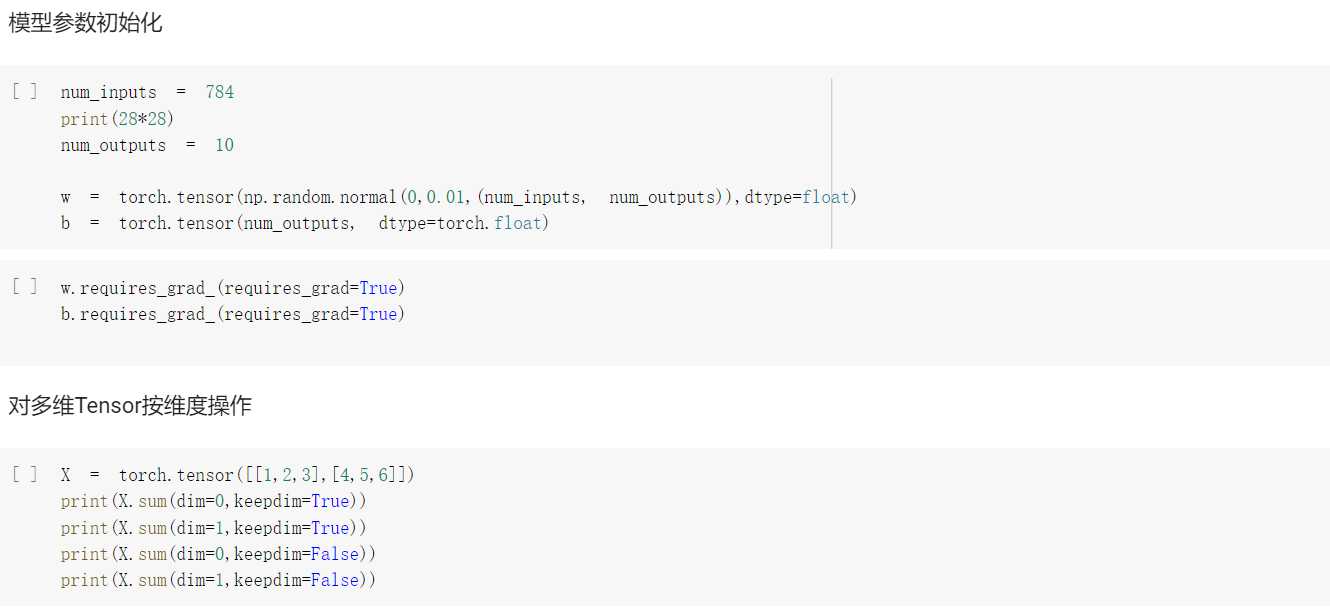
X = torch.tensor([[1, 2, 3], [4, 5, 6]])print(X.sum(dim=0, keepdim=True)) # dim为0,按照相同的列求和,并在结果中保留列特征print(X.sum(dim=1, keepdim=True)) # dim为1,按照相同的行求和,并在结果中保留行特征print(X.sum(dim=0, keepdim=False)) # dim为0,按照相同的列求和,不在结果中保留列特征print(X.sum(dim=1, keepdim=False)) # dim为1,按照相同的行求和,不在结果中保留行特征
# 在介绍如何定义softmax回归之前,我们先描述一下对如何对多维NDArray按维度操作。在下面的例子中,给定一个NDArray矩阵X。我们可以只对其中同一列(axis=0)或同一行(axis=1)的元素求和,并在结果中保留行和列这两个维度(keepdims=True)。
# In[49]:
X = nd.array([[1, 2, 3], [4, 5, 6]])X.sum(axis=0, keepdims=True), X.sum(axis=1, keepdims=True)
# ### 定义softmax操作# $$\hat{y}_j = \frac{ \exp(o_j)}{\sum_{i=1}^3 \exp(o_i)}$$
# In[50]:
def softmax(X): X_exp = X.exp() partition = X_exp.sum(axis=1, keepdims=True) return X_exp / partition # 这里应用了广播机制
# In[51]:
X = nd.random.normal(shape=(2, 5))X_prob = softmax(X)X_prob, X_prob.sum(axis=1)
# ### softmax回归模型# $$\begin{aligned} \boldsymbol{o}^{(i)} &= \boldsymbol{x}^{(i)} \boldsymbol{W} + \boldsymbol{b},\\ \boldsymbol{\hat{y}}^{(i)} &= \text{softmax}(\boldsymbol{o}^{(i)}). \end{aligned}$$
# In[52]:
def net(X): return softmax(nd.dot(X.reshape((-1, num_inputs)), W) + b)
# ### 定义损失函数# $$H\left(\boldsymbol y^{(i)}, \boldsymbol {\hat y}^{(i)}\right ) = -\sum_{j=1}^q y_j^{(i)} \log \hat y_j^{(i)},$$# $$\ell(\boldsymbol{\Theta}) = \frac{1}{n} \sum_{i=1}^n H\left(\boldsymbol y^{(i)}, \boldsymbol {\hat y}^{(i)}\right ),$$# $$\ell(\boldsymbol{\Theta}) = -(1/n) \sum_{i=1}^n \log \hat y_{y^{(i)}}^{(i)}$$
# In[39]:
y_hat = nd.array([[0.1, 0.3, 0.6], [0.3, 0.2, 0.5]])y = nd.array([0, 2], dtype=‘int32‘)nd.pick(y_hat, y)
# In[40]:
#下面实现了“softmax回归”一节中介绍的交叉熵损失函数。def cross_entropy(y_hat, y): return -nd.pick(y_hat, y).log()
# ### 定义准确率# 模型训练完了进行模型预测的时候,会用到这里定义的准确率。
# In[41]:
def accuracy(y_hat, y): return (y_hat.argmax(axis=1) == y.astype(‘float32‘)).mean().asscalar()
# In[42]:
print(accuracy(y_hat, y))
# In[53]:
# 本函数已保存在d2lzh包中方便以后使用。该函数将被逐步改进:它的完整实现将在“图像增广”一节中# 描述def evaluate_accuracy(data_iter, net): acc_sum, n = 0.0, 0 for X, y in data_iter: y = y.astype(‘float32‘) acc_sum += (net(X).argmax(axis=1) == y).sum().asscalar() n += y.size return acc_sum / n
# In[54]:
print(evaluate_accuracy(test_iter, net))
# ### 训练模型# 训练softmax回归的实现跟“线性回归的从零开始实现”一节介绍的线性回归中的实现非常相似。我们同样使用小批量随机梯度下降来优化模型的损失函数。在训练模型时,迭代周期数num_epochs和学习率lr都是可以调的超参数。改变它们的值可能会得到分类更准确的模型。
# In[55]:
num_epochs, lr = 5, 0.1
# 本函数已保存在d2lzh包中方便以后使用def train_ch3(net, train_iter, test_iter, loss, num_epochs, batch_size, params=None, lr=None, trainer=None): for epoch in range(num_epochs): train_l_sum, train_acc_sum, n = 0.0, 0.0, 0 for X, y in train_iter: with autograd.record(): y_hat = net(X) l = loss(y_hat, y).sum() l.backward() if trainer is None: d2l.sgd(params, lr, batch_size) else: trainer.step(batch_size) # “softmax回归的简洁实现”一节将用到 y = y.astype(‘float32‘) train_l_sum += l.asscalar() train_acc_sum += (y_hat.argmax(axis=1) == y).sum().asscalar() n += y.size test_acc = evaluate_accuracy(test_iter, net) print(‘epoch %d, loss %.4f, train acc %.3f, test acc %.3f‘ % (epoch + 1, train_l_sum / n, train_acc_sum / n, test_acc))
train_ch3(net, train_iter, test_iter, cross_entropy, num_epochs, batch_size, [W, b], lr)
# ### 预测# # 训练完成后,现在就可以演示如何对图像进行分类了。给定一系列图像(第三行图像输出),我们比较一下它们的真实标签(第一行文本输出)和模型预测结果(第二行文本输出)。
# In[56]:
for X, y in test_iter: break
true_labels = d2l.get_fashion_mnist_labels(y.asnumpy())pred_labels = d2l.get_fashion_mnist_labels(net(X).argmax(axis=1).asnumpy())titles = [true + ‘\n‘ + pred for true, pred in zip(true_labels, pred_labels)]
d2l.show_fashion_mnist(X[0:9], titles[0:9])
# In[ ]:
标签:实践 运动鞋 ast block 包括 相加 symbol 迭代 假设
原文地址:https://www.cnblogs.com/cathyc/p/12309149.html