标签:src code html scale img cal image orm atp


其中 %matplotlib inline 的解释见 https://www.cnblogs.com/emanlee/p/12358088.html
import random
import math
from scipy.stats import norm
import matplotlib.pyplot as plt
%matplotlib inline

def norm_dist_prob(theta):
    y = norm.pdf(theta, loc=3, scale=2)
    return y

T = 5000
pi = [0 for i in range(T)]
sigma = 1
t = 0
while t < T-1:
    t = t + 1
    pi_star = norm.rvs(loc=pi[t - 1], scale=sigma, size=1, random_state=None)
    alpha = min(1, (norm_dist_prob(pi_star[0]) / norm_dist_prob(pi[t - 1])))

    u = random.uniform(0, 1)
    if u < alpha:
        pi[t] = pi_star[0]
    else:
        pi[t] = pi[t - 1]


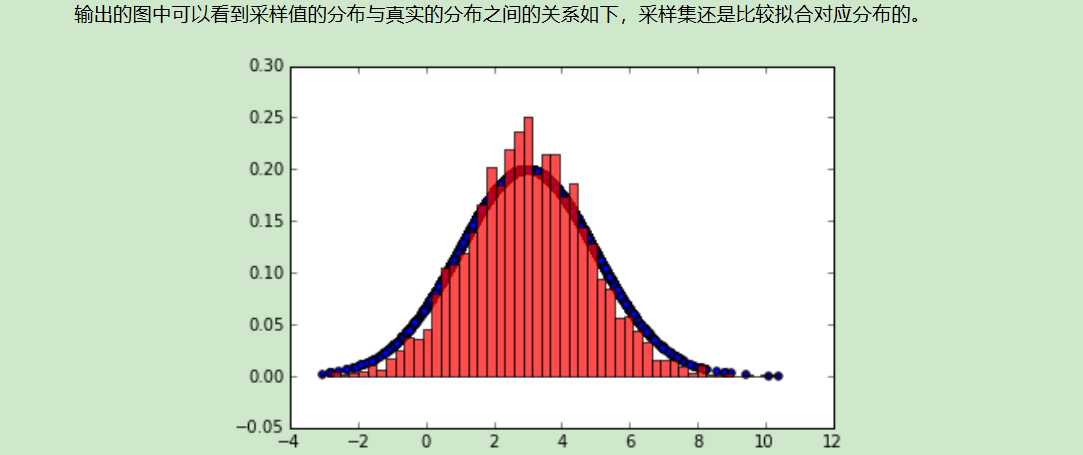
plt.scatter(pi, norm.pdf(pi, loc=3, scale=2))
num_bins = 50
plt.hist(pi, num_bins, normed=1, facecolor=‘red‘, alpha=0.7)
plt.show()
from
https://www.cnblogs.com/pinard/p/6638955.html
标签:src code html scale img cal image orm atp
原文地址:https://www.cnblogs.com/emanlee/p/12358022.html