标签:特殊 处理 plot orm tle width lse data for
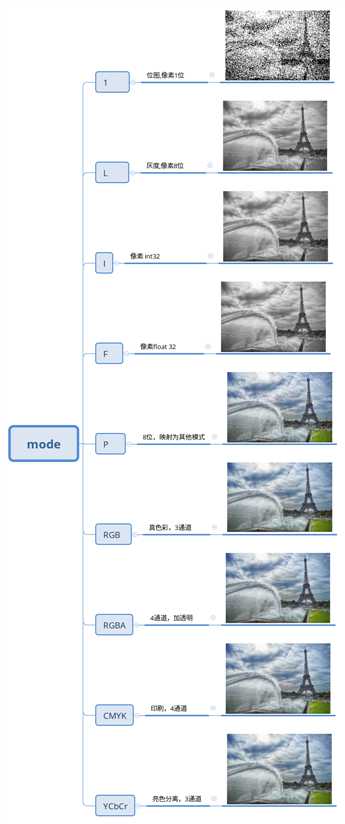
在本地找了jpg的图,convert为不同mode,将不同的图截取做了个脑图,有个直观的感觉吧。
把不同mode的图通过np.array()转化为array, 打印出array的shape, 和array[0, 0]的值, 便于理解不同mode的通道和像素值的存储。
1 部分结果见下:

2 部分代码和结果:
# 将不同模式的图片打印出shape 和 [0, 0]像素点的值
from PIL import Image
import matplotlib.pyplot as plt
image = Image.open(‘images/tower.jpg‘) # 本地一个文件
mode_list = [‘1‘, ‘L‘, ‘I‘, ‘F‘, ‘P‘, ‘RGB‘, ‘RGBA‘, ‘CMYK‘, ‘YCbCr‘ ]
for mode in mode_list:
    img = image.convert(mode)
    img_data = np.array(img)
    print(‘img_{:>1}.shape: {}‘ .format(mode, img_data.shape))
    print(‘img_{:>}_data[0, 0]: {}‘.format(mode, img_data[0, 0]))
    print(‘---‘)
# 以下为output
img_1.shape: (1276, 1920)
img_1_data[0, 0]: False
---
img_L.shape: (1276, 1920)
img_L_data[0, 0]: 88
---
img_I.shape: (1276, 1920)
img_I_data[0, 0]: 88
---
img_F.shape: (1276, 1920)
img_F_data[0, 0]: 88.94599914550781
---
img_P.shape: (1276, 1920)
img_P_data[0, 0]: 131
---
img_RGB.shape: (1276, 1920, 3)
img_RGB_data[0, 0]: [ 51  97 147]
---
img_RGBA.shape: (1276, 1920, 4)
img_RGBA_data[0, 0]: [ 51  97 147 255]
---
img_CMYK.shape: (1276, 1920, 4)
img_CMYK_data[0, 0]: [204 158 108   0]
---
img_YCbCr.shape: (1276, 1920, 3)
img_YCbCr_data[0, 0]: [ 88 160 100]
---
标签:特殊 处理 plot orm tle width lse data for
原文地址:https://www.cnblogs.com/Dean0731/p/12430791.html