标签:ext nim 颜色 ilog tor shadow blog 表示 matlab
1、使用semilogy、semilogx和loglog绘制指数函数的图像,示例:
%% 对指数进行绘图,使用不同的绘图函数
clear; clc; close all;
x = logspace(-1,1,100);  % 产生间距,在10^{-1}到10^{1}的100个点
y = x.^2;
subplot(2,2,1);
plot(x,y);   % 正常使用plot进行绘图
title('Plot');
subplot(2,2,2);
semilogx(x,y);    % 对x轴绘制间距为10的指数次方
title('Semilogx');
subplot(2,2,3);
semilogy(x,y);   % 对y轴绘制间距为10的指数次方
title('Semilogy');
subplot(2,2,4);
loglog(x, y);   % 对x,y绘制
title('Loglog');
set(gca,'XGrid','on');   % 显示网格
效果显示:

2、使用hist函数绘制柱状图,示例:
%% 显示柱状图
clear; clc; close all;
y = randn(1,100);   % 产生随机数,1000个
subplot(2,1,1);
hist(y,10);  % 显示柱状图
title('Bins = 10');
subplot(2,1,2);
hist(y,50);
title('Bins = 50');
效果显示:

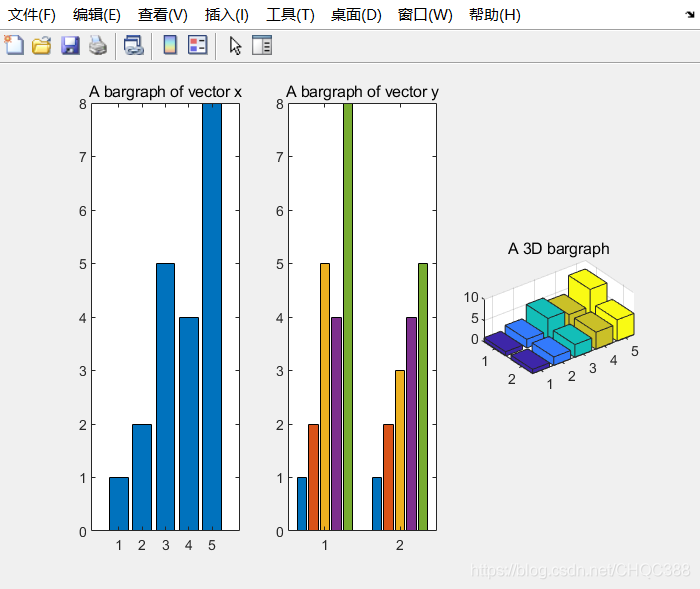
3、使用bar函数绘制条形图,示例:
%% 使用bar函数画条状图
clear; clc; close all;
x = [1 2 5 4 8];
y = [x;1:5];
subplot(1,3,1);
bar(x);   % 一维条状图
title('A bargraph of vector x');

subplot(1,3,2);
bar(y); % 二维条状图
title('A bargraph of vector y');

subplot(1,3,3);
bar3(y);  % 三维条状图
title('A 3D bargraph');
效果显示:

4、使用pie函数绘制饼状图,示例:
%% 饼状图
clear; clc; close all;
a = [10 15 20 30];   % 数据的占比
subplot(1,3,1);
pie(a);  % 画出饼状图,并且自动计算出百分比
subplot(1,3,2);
pie(a, [0,0,0,1]);   % 将第四个饼状图提取出来
subplot(1,3,3);
pie3(a, [0,0,0,1]);  % 画三维饼状图,并且最后一个提取出来
效果显示:

5、使用polar函数绘制极坐标图,示例:
%% 极坐标图
clear; clc; close all;
x = 1:100;
theta = x/10;
r = log10(x);
polar(theta,r);  % 只需要给出角度和半径即可
效果显示:

6、使用stairs函数绘制阶梯图,示例:
%% 阶梯图
clear; clc; close all;
x = linspace(0, 4*pi, 40);
y = sin(x);
stairs(y);  % 阶梯图
效果显示:

7、使用stem绘制杆状图,示例:
%% 杆状图
clear; clc; close all;
x = linspace(0, 4*pi, 40);
y = sin(x);
stem(y);  % 杆状图
效果显示:

8、使用scatter函数绘制散点图,示例:
%% 散点图
clear; clc; close all;
figure;
x=[1 3 4 7 9 10 15];
y=[5 3 5 9 7 3 7];
subplot(1,2,1);
scatter(x,y);   % 显示散点
subplot(1,2,2);
scatter(x,y,[],[1 0 0],'fill')   % 散点的颜色和填充,[]表示圆的大小相同
效果显示:

9、使用compass函数绘制罗盘图,示例:
%%  绘制罗盘图
clear ;clc; close all;
x=[1 -3 5 -6 8 9];
y=[5 7 -9 12 15 -9];
figure;
compass(x,y,'r');       % 绘制罗盘图
效果示例:

10、使用feather函数绘制羽毛图,示例:
%% 羽毛图
clear;clc; close all;
x=[1 3 5 6 8 9];
y=[5 7 -9 3 -5 2];
figure;
feather(x,y);  % 羽毛形状的图
效果显示:

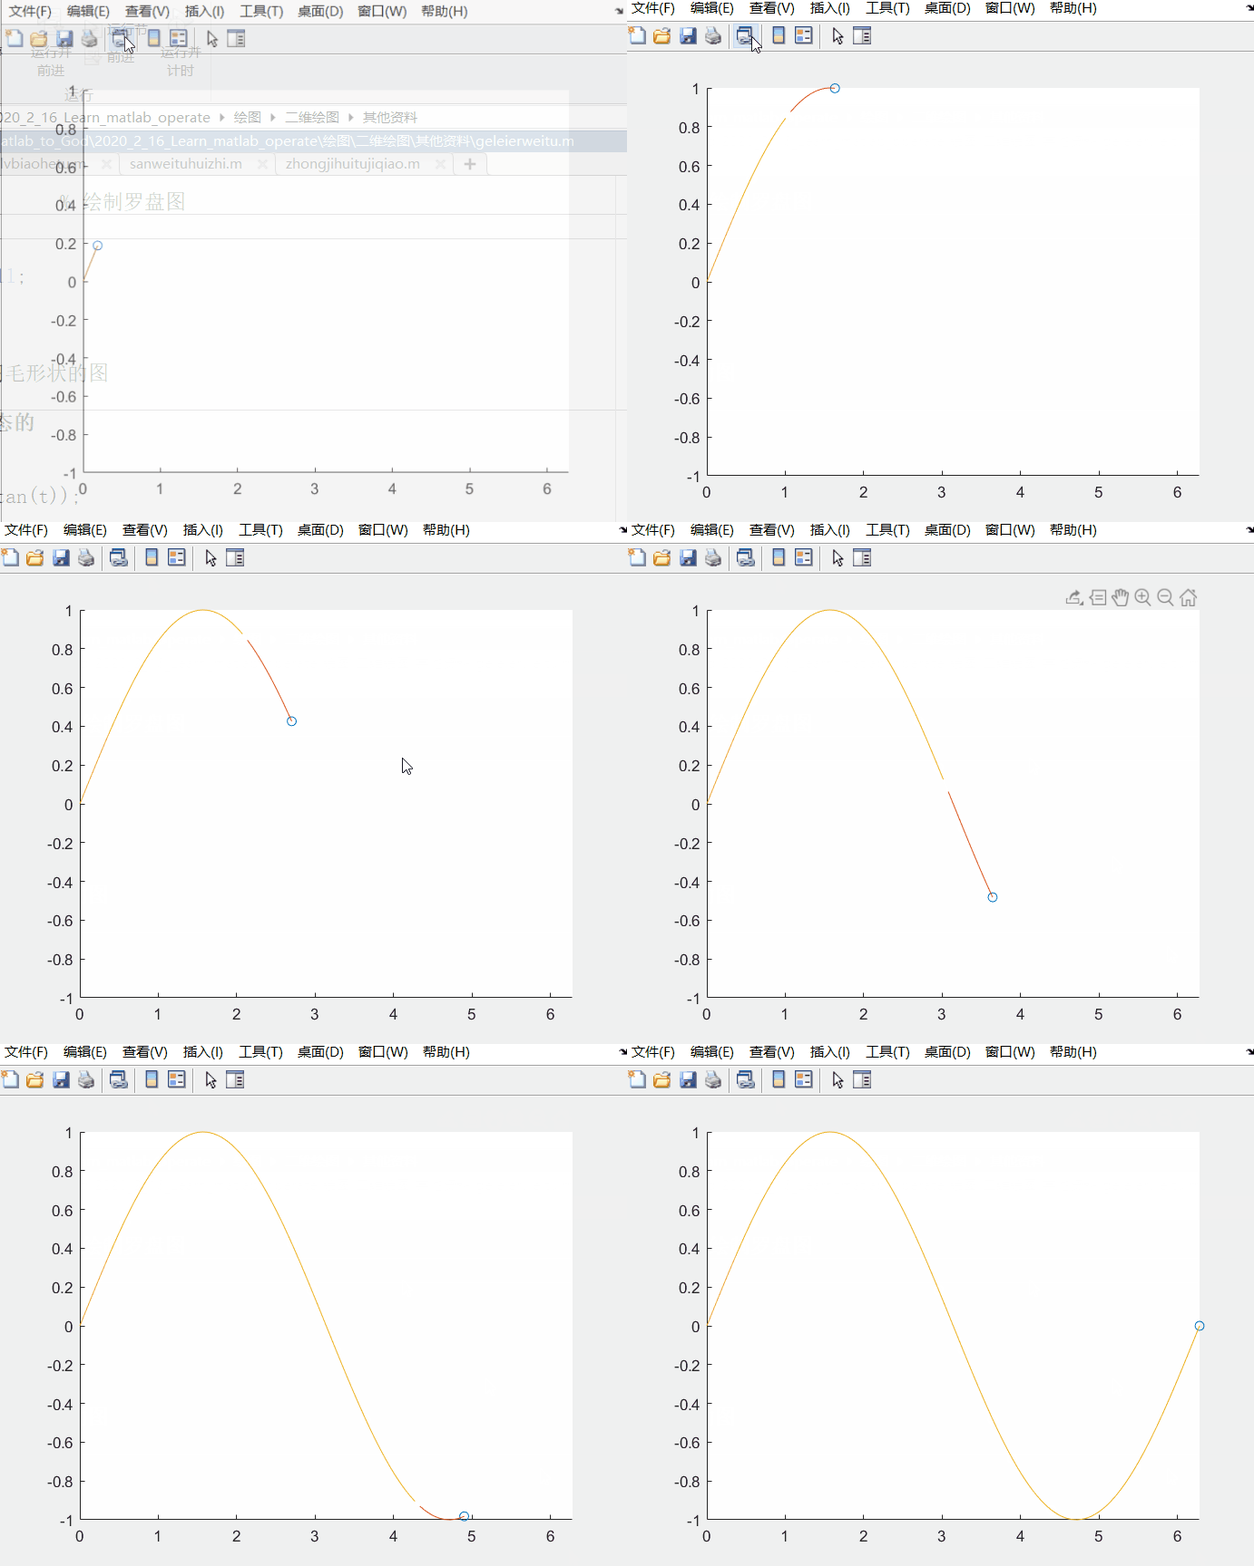
11、使用comet函数绘制彗星图,示例:
%% 绘制彗星图,动态图
clear ;clc; close all;
x = 0:pi/50:2*pi;
y = sin(x);
comet(x,y);  % 画动态图
效果显示:

12、使用boxplot函数绘制盒图,示例:
%%   正整数的频率表
clear;clc; close all;
a=normrnd(1,4,50,1);
b=normrnd(5,1,50,1);
x=[a b];
subplot(1,2,1);
boxplot(x,'notch','on','symbol','b*','orientation','vertical');
subplot(1,2,2);
boxplot(x,'notch','off','symbol','r+','orientation','horizontal');
效果显示:

13、使用plotyy同时绘制两条曲线,示例:
%% 使用plotyy画两条曲线,修改曲线的属性
clear; clc; close all;
x = 0:0.01:20;
y1 = 200*exp(-0.05*x).*sin(x);
y2 = 0.8*exp(-0.5*x).*sin(10*x);
[AX,H1,H2] = plotyy(x,y1,x,y2);  % 获取axes句柄和两条线段的句柄
set(get(AX(1),'Ylabel'),'String','Left Y-axis');  % 设置线段1的label
set(get(AX(2),'Ylabel'),'String','Right Y-axis');  % 设置线段2的label
title('Labeling plotyy');  % 显示标题
set(H1,'LineStyle','--');  % 设置两条线的风格
set(H2,'LineStyle',':');
效果显示:

14、使用fill函数绘制填充特殊图形。示例:
%% 画特殊的图形,并且填充颜色
clear; clc; close all;
t =(1:2:15)'*pi/8;   % 画8边形,将一个圆分为16份
x = sin(t); % x的表示和y的表示
y = cos(t);

subplot(1,2,1);
h = fill(x,y,'r'); % 填充画出来的封闭图形
set(h,'LineWidth',5);   % 设置线宽的大小
axis square off;  % 不显示axes
text(0,0,'STOP','Color', 'w', 'FontSize', 40, ...
'FontWeight','bold', 'HorizontalAlignment', 'center');

t1 =(1:4)'*pi/2;
x1 = sin(t1);
y1 = cos(t1);
subplot(1,2,2);
h = fill(x1,y1,'y');
set(h,'LineWidth',5);   % 获取句柄h设置边框线段的大小
axis square off;
text(0,0,'WALT','Color', 'b', 'FontSize', 30, ...
'FontWeight','bold', 'HorizontalAlignment', 'center');
效果显示:

15、使用fplot绘制光滑的曲线,示例:
%%  使用fplot绘制光滑的曲线图
clear; clc; close all;
x=-2:0.1:4;
subplot(1,2,1);
plot(x,humps(x));
title('plot');
subplot(1,2,2);
fplot(@humps,[-2 4])  % 光滑绘图
title('fplot');
效果显示:

标签:ext nim 颜色 ilog tor shadow blog 表示 matlab
原文地址:https://www.cnblogs.com/zhicungaoyuan-mingzhi/p/12447071.html