码迷,mamicode.com
首页 > 其他好文 > 详细

vue中绘制echarts折线图

时间:2020-03-22 10:42:40      阅读:899      评论:0      收藏:0      [点我收藏+]

标签:pre   lse   title   one   2-2   color   ima   normal   tip   

1.安装echarts
cnpm install echarts --save

2.vue代码

<template>
    <div>
    //下面的div给表一个容器
       <div id="myChart" :style="{width: ‘1000px‘, height: ‘500px‘}"></div>
    </div>
</template>
<script>
    // 引入基本模板
    let echarts = require(‘echarts/lib/echarts‘);
    // 引入柱状图组件
    require(‘echarts/lib/chart/bar‘);
    // 引入提示框和title组件
    require(‘echarts/lib/component/tooltip‘);
    require(‘echarts/lib/component/title‘);
    export default {
        name: "DataCount",
        data: () => ({
            msg: ‘Welcome to Your Vue.js App‘
        }),
        mounted(){
            this.drawLine();
        },
        methods:{
            drawLine(){
                // 基于准备好的dom,初始化echarts实例
                let myChart = this.$echarts.init(document.getElementById(‘myChart‘));
                // 绘制图表
                myChart.setOption({
                    title: {
                        text: ‘‘,
                        subtext: ‘‘
                    },
                    tooltip: {
                        trigger: ‘axis‘
                    },
                    legend: {
                        data:[‘最高‘,‘最低‘]
                    },
                    toolbox: {
                        show: true,
                        feature: {
                            dataZoom: {
                                yAxisIndex: ‘none‘
                            },
                            dataView: {readOnly: false},
                            magicType: {type: [‘line‘, ‘bar‘]},
                            restore: {},
                            saveAsImage: {}
                        }
                    },
                    xAxis:  {
                        type: ‘category‘,
                        boundaryGap: false,
                        data: [‘2019-02-25‘,‘2019-03-04‘,‘2019-03-18‘,‘2019-03-26‘,‘2019-04-16‘,‘2019-04-26‘,‘2019-05-04‘]
                    },
                    yAxis: {
                        type: ‘value‘,
                        axisLabel: {
                            formatter: ‘{value}‘
                        }
                    },
                    series: [
                        {
                            name:‘最高‘,
                            type:‘line‘,
                            data:[11, 11, 15, 13, 12, 13, 10],
                            markPoint: {
                                data: [
                                    {type: ‘max‘, name: ‘最大值‘},
                                    {type: ‘min‘, name: ‘最小值‘}
                                ]
                            },
                            markLine: {
                                data: [
                                    {type: ‘average‘, name: ‘平均值‘}
                                ]
                            }
                        },
                        {
                            name:‘最低‘,
                            type:‘line‘,
                            data:[1, -2, 2, 5, 3, 2, 0],
                            markPoint: {
                                data: [
                                    {name: ‘周最低‘, value: 2, xAxis: 1, yAxis: 1.5}
                                ]
                            },
                            markLine: {
                                data: [
                                    {type: ‘average‘, name: ‘平均值‘},
                                    [{
                                        symbol: ‘none‘,
                                        x: ‘90%‘,
                                        yAxis: ‘max‘
                                    }, {
                                        symbol: ‘circle‘,
                                        label: {
                                            normal: {
                                                position: ‘start‘,
                                                formatter: ‘最大值‘
                                            }
                                        },
                                        type: ‘max‘,
                                        name: ‘最高点‘
                                    }]
                                ]
                            }
                        }
                    ]
                });
            }
        }
    }
</script>

3.效果图如下
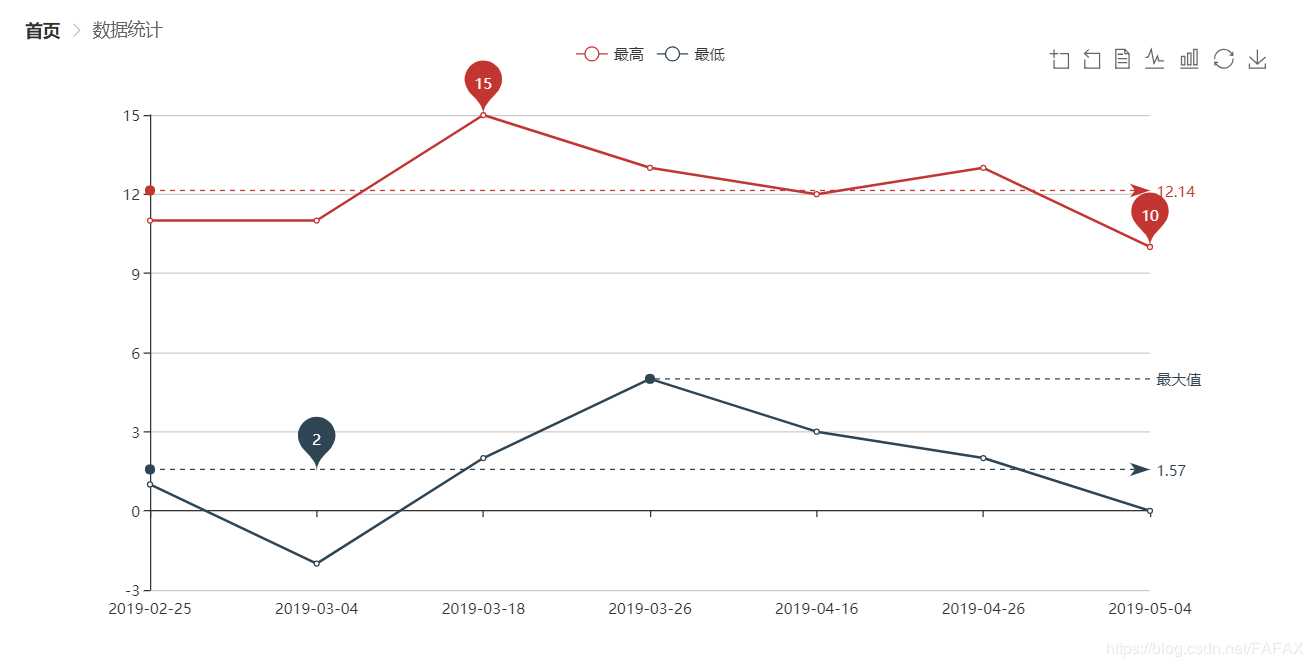
技术图片


vue中绘制echarts折线图

标签:pre   lse   title   one   2-2   color   ima   normal   tip   

原文地址:https://www.cnblogs.com/yanl55555/p/12544109.html

(0)
(0)
   
举报
评论 一句话评论(0
登录后才能评论!
© 2014 mamicode.com 版权所有  联系我们:gaon5@hotmail.com
迷上了代码!