标签:idt 统计 sql语句 cursor python class width 通过 plt
线性回归在百度百科的解释:线性回归是利用数理统计中回归分析,来确定两种或两种以上变量间相互依赖的定量关系的一种统计分析方法,运用十分广泛。其表达形式为y = w‘x+e,e为误差服从均值为0的正态分布。
设备监测值随着时间序列变化的趋势,按照上面的解释,我们要找到Y和X,才能得到回归的方程。很清楚,Y代表着设备监测值,X代表着时间序列。按照线性回归的话。可得到方程为:
Y = aT + b Y为设备监测值的预测值,T相当于时间序列。
我们的目标就是求出a和b的值,画出预测值关于时间序列的线,就能够得到预测值相对于时间的趋势。问题时预测值肯定会出现误差,那么如何体现误差呢?
同过上述方程式。我们能得到某个时间点的预测值,通过数据库存的数据我们能够得到实际值。那么,我们假设在某个T时间点,预测值为Y,实际值为Y。那么我们能得到残差为:Y-Y。
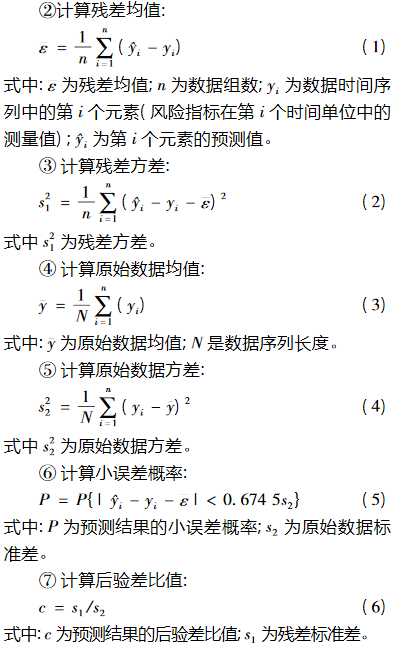
如果在理想状态下,我们取无数个时间节点,我们就能得到这些节点的时间残差集合,然后我们取平均,得到残差均值ε。公式为:

图1.1
残差均值ε就能体现误差的大小,ε越趋向于0,预测越精准。
想要更加准确我们可以通过以下方法进行误差计算,当然会比较复杂:

图 1.2
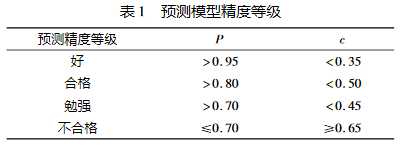
得出c和p就可以通过下表得出预测模型的精度等级:

图1.3
import time
from sklearn import datasets, linear_model, discriminant_analysis
import numpy as np
import matplotlib.pyplot as plt
import pymssql


def conn():
    connect = pymssql.connect(‘ip‘, ‘sa‘, ‘******‘, ‘test‘)  # 服务器名,账户,密码,数据库名
    if connect:
        print("connect successfully!!")
    return connect


def getArry():
    connect = conn()
    cursor = connect.cursor()  # 创建一个游标对象,python里的sql语句都要通过cursor来执行
    sql = "select * from * where * = ‘**‘"
    cursor.execute(sql)  # 执行sql语句
    row = cursor.fetchone()  # 读取查询结果,
    factor_list = []
    target_list = []
    while row:
        factor_list_ele = []
        target_list_ele = []
        factor_list_ele.append(int(time.mktime(time.strptime(str(row[0]), "%Y-%m-%d %H:%M:%S")))) #将时间戳存进去
        target_list_ele.append(row[1])
        factor_list.append(factor_list_ele)
        target_list.append(target_list_ele)
        row = cursor.fetchone()

    return factor_list,target_list

def load_data():
    diabetes = getArry()  # 导入数据
    diabetes_X_train = diabetes[0][:-75]  # 取39000个样本作为训练样本
    diabetes_X_test = diabetes[0][-75:]  # 后475个作为测试样本
    diabetes_y_train = diabetes[1][:-75]  # 同理
    diabetes_y_test = diabetes[1][-75:]
    return diabetes_X_train, diabetes_y_train, diabetes_X_test, diabetes_y_test


def test_LinearRegrssion(*data):
    data = load_data()
    regr = linear_model.LinearRegression()
    regr.fit(data[0], data[1])  # 利用训练样本进行训练
    plt.scatter(data[2], data[3], c=‘red‘)  # 将测试样本集画出来
    plt.plot(data[2], regr.predict(data[2]), color=‘blue‘, linewidth=2)
    print(‘系数:%s,截距:%.2f‘ % (regr.coef_, regr.intercept_))
    print("平均方差值:%.2f" % np.mean((regr.predict(data[2]) - data[3]) ** 2))  # 均方误差
    print(‘得分:%.2f‘ % regr.score(data[2], data[3]))  # 得分,值越接近1,效果越好,也可为负数,训练效果很差的情况下
    plt.grid()
    plt.show()


test_LinearRegrssion()
语言:Python
模块介绍:numpy--矩阵计算模块,sklearn--机器学习模块,matplotlib--绘图模块
数据来源:公司服务器
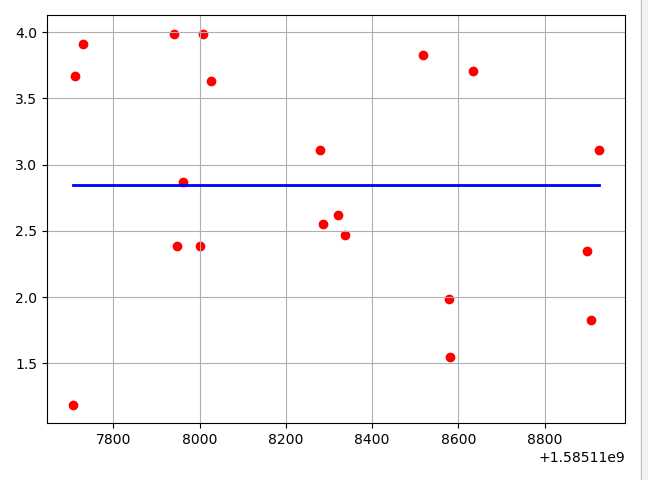
数据量:39475 39450作为训练数据 25 作为测试数据
趋势图:

结果:
得分越趋近于1,预测越精准。平均方差值越趋近于0,预测越精准。
心得体会:估计还得换个模型继续看看吧,这个失败了。
图1.1 图1.2 图1.3 来自:《煤矿灾害风险预警的方法及模型》--黄竟文
标签:idt 统计 sql语句 cursor python class width 通过 plt
原文地址:https://www.cnblogs.com/liangxuBlog/p/12566783.html