标签:显示 size image src mat 折线图 进阶 dpi sha
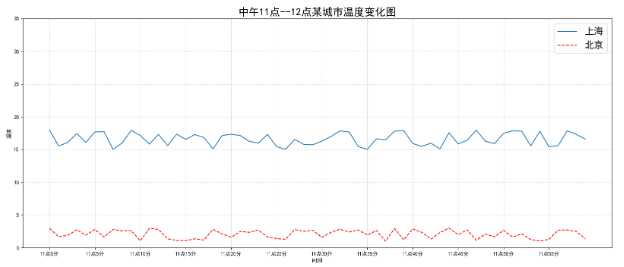
使用多次plot方法
plt.plot(x, y_shanghai, label="上海")
plt.plot(x, y_beijing, color="r", linestyle="--", label="北京")

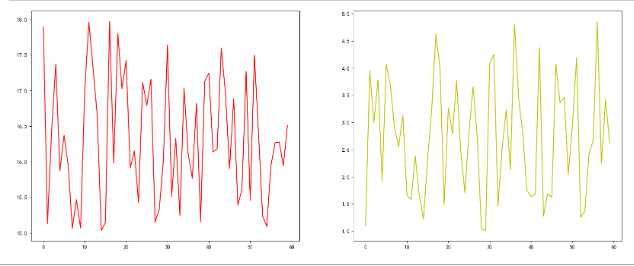
使用subplots创建画布
# 创建画布
fig, axes = plt.subplots(nrows=1, ncols=2, figsize=(20, 8), dpi=100)

# 绘制图形
axes[0].plot(x,y_shanghai, label=‘上海‘, color=‘r‘)
axes[1].plot(x,y_beijing, label=‘北京‘)

# 显示
plt.show()

标签:显示 size image src mat 折线图 进阶 dpi sha
原文地址:https://www.cnblogs.com/chao666/p/12588735.html