标签:bin 维数 == 自带 plt 通过 ppa stand das
(1)图片压缩
以下为使用k-means代码进行图片压缩
from sklearn.datasets import load_sample_image
from sklearn.cluster import KMeans
import matplotlib.pyplot as plt
import sys
import numpy as np
from pylab import mpl

# 指定默认字体
mpl.rcParams[‘font.sans-serif‘] = [‘FangSong‘]
# 解决保存图像是负号‘-‘显示为方块
mpl.rcParams[‘axes.unicode_minus‘] = False
##读取datasets库中的图片
image = load_sample_image("china.jpg")
#查看图片
plt.imshow(image)
plt.show()

##观察图片文件大小,数据结构
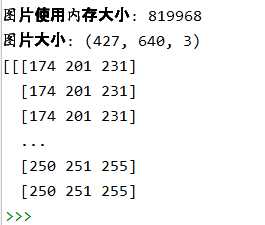
print("图片使用内存大小:",sys.getsizeof(image))
print("图片大小:",image.shape)
print(image)
##数据线性化
image1=image[::3, ::3]
X = image1.reshape(-1,3)
print(image.shape,X.shape)


###用kmeans对图片像素颜色进行聚类
n_colors = 64
K_model = KMeans(n_colors)
#归类以后的颜色分类期望值
y = K_model.fit_predict(X)
#每个类别的颜色,二维数组
colors = K_model.cluster_centers_
print(y.shape,colors.shape)

##压缩生成,还原为二维
new_image = colors[y].reshape(image1.shape)
new_image.shape
new_image.size
#对比
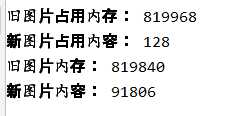
print("旧图片占用内存:",sys.getsizeof(image))
print("新图片占用内容:",sys.getsizeof(new_image))
print("旧图片内存:",image.shape)
print("新图片内容:",new_image.shape)

#生成图像
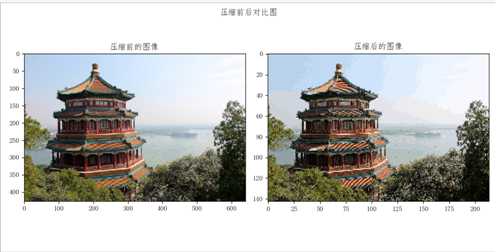
plt.figure(figsize=(10,5))#画布
plt.subplot(1, 2, 1)
plt.imshow(image)
plt.title("压缩前的图像")
plt.subplot(1, 2, 2)
plt.title("压缩后的图像")
plt.imshow(new_image.astype(np.uint8))
plt.suptitle("压缩前后对比图")
plt.show()
实际效果:
(2)实际运用
通过租房信息来预测该租房是否自带燃气
#K-meavn算法
import numpy as np
import pandas as pd
from sklearn.model_selection import train_test_split
from sklearn.cluster import  KMeans
from sklearn import preprocessing
from sklearn.metrics import jaccard_score,fowlkes_mallows_score,adjusted_rand_score

data=pd.read_csv("201706120024陈圳锐(处理后).csv")
y=data[‘燃气‘].values
x=data.drop(‘燃气‘,axis=1).values
#分箱处理调优
# a=0
# count1=0
# count2=0
# for i in range(2,20):
#     for index in range(2,20):
#         print(i,index)
#         #quantile
#         est = preprocessing.KBinsDiscretizer(n_bins=[i, index], encode=‘ordinal‘,strategy=‘uniform‘).fit(data[[‘面积‘,‘租金‘]].values)
#         x1=est.transform(data[[‘面积‘,‘租金‘]].values)
#         x=data.drop(‘面积‘,axis=1).drop(‘租金‘,axis=1).values
#         x=np.hstack((x1,x))
#
#
#         #zscore标准化处理
#         zscore_scaler = preprocessing.StandardScaler()  # 建立StandardScaler对象
#         x=zscore_scaler.fit_transform(data.drop(‘燃气‘,axis=1).values)
#
#         x_train,x_test,y_train,y_test=train_test_split(x,y,test_size=0.2,random_state=5)
#
#         KMeans_model = KMeans(n_clusters=2)
#         KMeans_model.fit(x_train)
#         from sklearn import metrics
#         y_pre=KMeans_model.predict(x_test)
#         if  a<metrics.accuracy_score(y_test, y_pre):
#             count1=i
#             count2=index
#             a=metrics.accuracy_score(y_test, y_pre)
#
#         print(‘准确率指标:‘,metrics.accuracy_score(y_test,y_pre ))

#分箱处理
est = preprocessing.KBinsDiscretizer(n_bins=[19, 19,19], encode=‘ordinal‘,strategy=‘uniform‘).fit(data[[‘面积‘,‘租金‘,‘楼层‘]].values)
x1=est.transform(data[[‘面积‘,‘租金‘,‘楼层‘]].values)
x=data.drop(‘面积‘,axis=1).drop(‘楼层‘,axis=1).drop(‘租金‘,axis=1).values
x=np.hstack((x1,x))


#zscore标准化处理
zscore_scaler = preprocessing.StandardScaler()  # 建立StandardScaler对象
x=zscore_scaler.fit_transform(data.drop(‘燃气‘,axis=1).values)

#划分数据集
x_train,x_test,y_train,y_test=train_test_split(x,y,test_size=0.2,random_state=5)

#构建模型
KMeans_model = KMeans(n_clusters=2,random_state=5)
#训练模型
KMeans_model.fit(x_train)
#预测测试集
y_pre=KMeans_model.predict(x_test)
from sklearn import metrics
# KMeans_model.score(x_test,y_test)
print("201706120024陈圳锐17级软件工程一班")
print(‘准确率指标:‘,metrics.accuracy_score(y_test,y_pre ))
print(‘聚类中心为:\n‘,KMeans_model.cluster_centers_)    #查看聚类中心
print(‘类别标签为:\n‘,KMeans_model.labels_)
print("参与的测试个数:",x_test.shape[0])
print("预测正确个数:",x_test.shape[0]*metrics.accuracy_score(y_test,y_pre ))
print(‘准确率指标:‘,metrics.accuracy_score(y_test, y_pre))  # 计算准确率
print(‘Kappa指标:‘,metrics.cohen_kappa_score(y_test, y_pre)) # Kappa 检验
print(‘混淆矩阵:\n‘,metrics.confusion_matrix(y_test, y_pre)) # 混淆矩阵

print("201706120024陈圳锐17级软件工程一班")
target_names = [‘无燃气‘,‘有燃气‘]
print(‘分类报告:\n‘,metrics.classification_report(y_test, y_pre,target_names=target_names))# 分类报告
print(‘汉明损失:‘,metrics.hamming_loss(y_test, y_pre))  #汉明损失 。在多分类中, 汉明损失对应于 y 和 y_pre 之间的s汉明距离
print(‘杰卡德系数:‘,metrics.jaccard_score(y_test, y_pre))


list1=[]
list2=[]
list3=[]
for index in range(len(x_train)):
    center_index=KMeans_model.labels_
    if int(center_index[index])==0:
        list1.append(np.sqrt(sum(abs((x[index,:]-KMeans_model.cluster_centers_[int(center_index[index]),:]))**2)))
    elif int(center_index[index])==1:
        list2.append(np.sqrt(sum(abs((x[index,:]-KMeans_model.cluster_centers_[int(center_index[index]),:]))**2)))
cp1=np.mean(list1)
cp2=np.mean(list2)
cp_mean=(cp1+cp2)/2
print("该聚类的cp为:"+str(cp_mean))

#求sp
list4=[]
for index in range(len(KMeans_model.cluster_centers_)):
    for index1 in range(index+1,len(KMeans_model.cluster_centers_)):
        #print(index,index1)
        list4.append(np.sqrt(sum(abs(KMeans_model.cluster_centers_[index, :] - KMeans_model.cluster_centers_[index1, :]) ** 2)))
sp=np.mean(list4)
print("该聚类的sp为:"+str(sp))

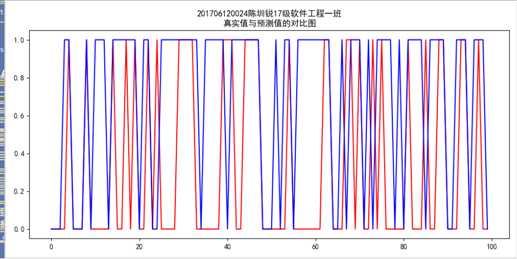
import matplotlib.pyplot as plt  # 可视化绘制
plt.rcParams[‘font.sans-serif‘] = ‘SimHei‘# 设置中文显示
fig = plt.figure(figsize = (10,5))
plt.plot(range(100), KMeans_model.predict(x_test)[0:100],color="red")
plt.plot(range(100), y_test[0:100],color="blue")
plt.title(‘201706120024陈圳锐17级软件工程一班\n真实值与预测值的对比图‘)
plt.savefig(‘k-means真实值与预测值的对比图.png‘)
plt.show()
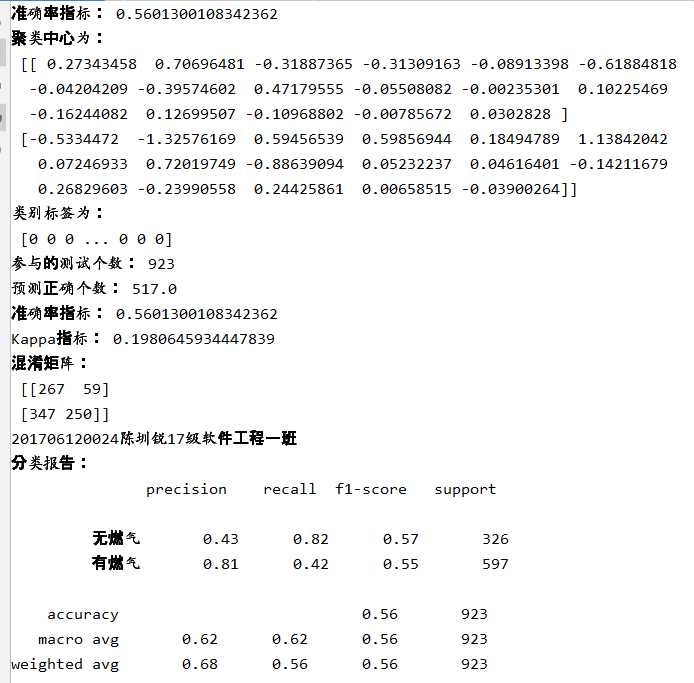
该模型的实际效果
标签:bin 维数 == 自带 plt 通过 ppa stand das
原文地址:https://www.cnblogs.com/renshenbenzuig/p/12733402.html