标签:eval excel tle tom led enum inf pie def
def getDataDict():
dataFrame = pandas.read_excel(‘D:/Py/2010人口普查.xlsx‘,skiprows=2)
raceList = list(map(lambda s:str(s).replace("\xa0",""),dataFrame.iloc[0,1:][::3].tolist()))
ageList = list(map(lambda s:str(s).replace("\xa0",""),dataFrame.iloc[2:, 0].tolist()))
dataDict = OrderedDict()
for i in range(len(raceList)):
race = raceList[i]
raceDict = OrderedDict()
raceDictKeyList = dataFrame.iloc[1,1+3*i:1+3*i+3].tolist()
for j in range(len(raceDictKeyList)):
raceDictKey = raceDictKeyList[j]
ageValueList = dataFrame.iloc[2:,1+3*i+j].tolist()
trdDict = OrderedDict()
for k in range(len(ageValueList)):
age = str(ageList[k])
trdDict[age] = ageValueList[k]
raceDict[raceDictKey] = trdDict
dataDict[race] = raceDict
return dataDict
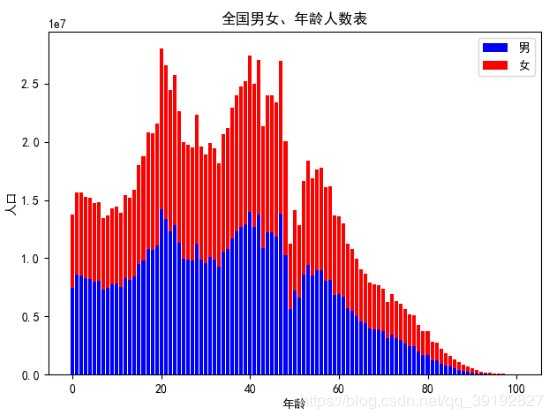
def showChart1():
maleDict = dataDict.get(‘合计‘).get(‘男‘)
femaleDict = dataDict.get(‘合计‘).get(‘女‘)
maleNumList = []
for i, items in enumerate([maleDict.items(), femaleDict.items()]):
ageList = []
numList = []
for k, v in items:
if str(k).isdigit() or str(k) == ‘100岁及以上‘:
if (str(k) == ‘100岁及以上‘):
k = ‘100‘
ageList.append(int(k))
numList.append(v)
if i == 0:
maleNumList = numList[:]
if i == 0:
male = pyplot.bar(ageList, numList, color=‘b‘)
else:
female = pyplot.bar(ageList, numList, bottom=maleNumList, color=‘r‘)
pyplot.rcParams[‘font.sans-serif‘] = [‘SimHei‘]
pyplot.title(‘全国男女、年龄人数表‘)
pyplot.xlabel(‘年龄‘)
pyplot.ylabel(‘人口‘)
pyplot.legend((male[0], female[2]), (‘男‘, ‘女‘))
pyplot.show()
def showChart2():
data = dataDict.get(‘合计‘).get(‘合计‘)
ageCountList = []
ageLabelList = []
for k, v in data.items():
if not str(k).isdigit() and str(k) != ‘总计‘ and str(k) != ‘nan‘:
ageCountList.append(int(v))
ageLabelList.append(k)
index = ageLabelList.index(‘75-79岁‘)
numOld = 0
for i in range(len(ageCountList)):
if i >= index:
numOld += ageCountList[i]
else:
pass
ageCountList[index] = numOld
ageLabelList[index] = ‘75岁及以上‘
ageCountList = ageCountList[:index + 1]
ageLabelList = ageLabelList[:index + 1]
pyplot.title(‘全国人口年龄分布图‘)
pyplot.rcParams[‘font.sans-serif‘] = [‘SimHei‘]
pyplot.pie(ageCountList, labels=ageLabelList, counterclock=False, autopct=‘%1.1f%%‘)
pyplot.show()


标签:eval excel tle tom led enum inf pie def
原文地址:https://www.cnblogs.com/3072952697whl/p/12862822.html