标签:pen 模拟 osi print hits where plot ima otl
import random
import numpy as np
import matplotlib.pyplot as plt

position = 0
walk = [position]
steps = 100
x = []
y = []
for i in range(steps):
    step = 1 if random.randint(0,1) else -1
    position += step
    x.append(i)
    y.append(position)
    walk.append(position)

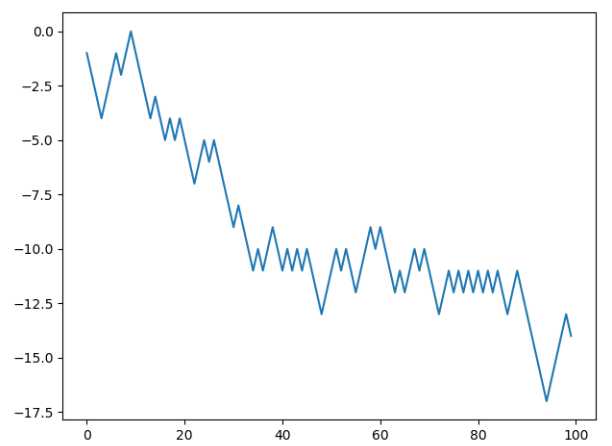
plt.plot(x,y)
plt.show()

一次模拟多个随机漫步
import numpy as np

nwalks = 5000
nsteps = 1000
draws = np.random.randint(0,2,size=(nwalks,nsteps))
steps = np.where(draws>0,1,-1)
walks = steps.cumsum(1)
print(walks)
‘‘‘
[[  1   0   1 ... -10 -11 -12]
 [  1   0  -1 ...  -4  -5  -6]
 [ -1   0   1 ... -14 -13 -14]
 ...
 [  1   2   3 ...  80  81  82]
 [  1   0   1 ...  38  37  36]
 [  1   0   1 ...  72  73  74]]
‘‘‘
print(walks.max()) # 140
print(walks.min()) #-108

hits30 = (np.abs(walks)>=30).any(1)
print(hits30) # [ True False False ...  True  True  True]
print(hits30.sum()) #3408

crossing_times = (np.abs(walks[hits30])>30).argmax(1)
print(crossing_times.mean()) # 算术平均数 486.78372093023256
标签:pen 模拟 osi print hits where plot ima otl
原文地址:https://www.cnblogs.com/nicole-zhang/p/12931204.html