标签:网上 com echarts yun service 等等 效果 ffd json
api_url = f‘{api_url}{quote(location_name)}&output=json&ak=你的ak‘from urllib.request import urlopen, quote
import json
from pyecharts import GeoLines, Style
def get_location_coordinate(location_name):
api_url = ‘http://api.map.baidu.com/geocoding/v3/?address=‘
api_url = f‘{api_url}{quote(location_name)}&output=json&ak=你的ak‘
result = urlopen(api_url)
result = json.loads(result.read().decode())[‘result‘][‘location‘]
return result[‘lng‘], result[‘lat‘]
# 参考小文的
def plot_geolines(plotting_data, geo_cities_coords):
# 设置画布的格式
style = Style(title_pos="center",
width=1000,
height=800)
# 部分地理轨迹图的格式
style_geolines = style.add(is_label_show=True,
line_curve=0.3, # 轨迹线的弯曲度,0-1
line_opacity=0.6, # 轨迹线的透明度,0-1
geo_effect_symbol=‘plane‘, # 特效的图形,有circle,plane,pin等等
geo_effect_symbolsize=10, # 特效图形的大小
geo_effect_color=‘#7FFFD4‘, # 特效的颜色
geo_effect_traillength=0.1, # 特效图形的拖尾效果,0-1
label_color=[‘#FFA500‘, ‘#FFF68F‘], # 轨迹线的颜色,标签点的颜色,
border_color=‘#97FFFF‘, # 边界的颜色
geo_normal_color=‘#36648B‘, # 地图的颜色
label_formatter=‘{b}‘, # 标签格式
legend_pos=‘left‘)
# 作图
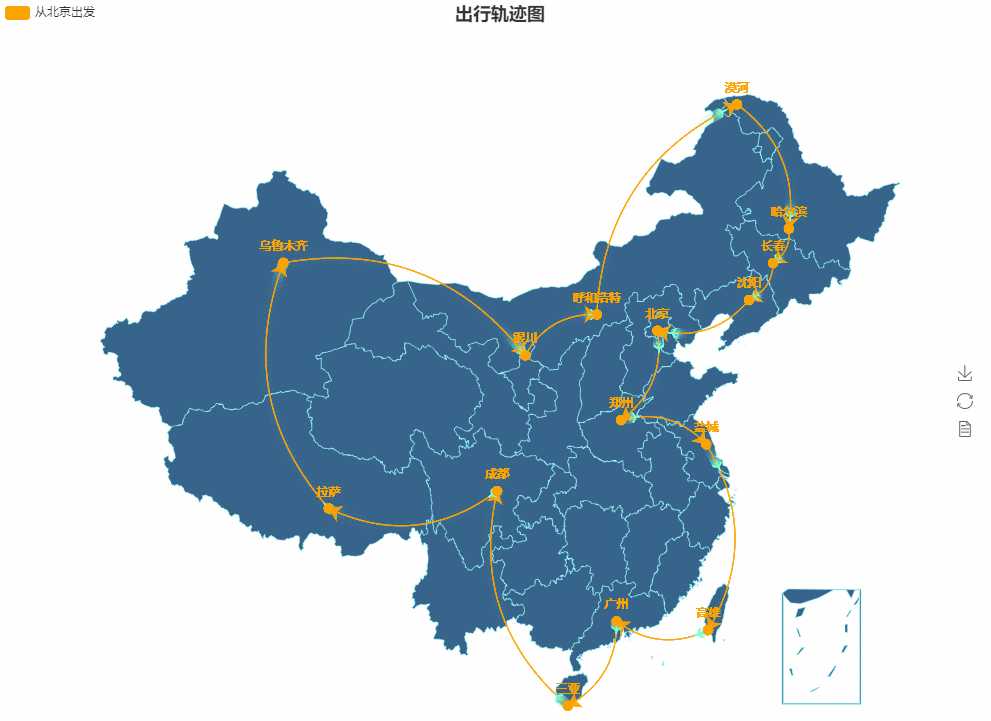
geolines = GeoLines(‘出行轨迹图‘, **style.init_style)
geolines.add(‘从北京出发‘,
plotting_data,
maptype=‘china‘, # 地图的类型,可以是省的地方,如‘广东‘,也可以是地市,如‘东莞‘等等
geo_cities_coords=geo_cities_coords,
**style_geolines)
# 发布,得到图形的html文件
geolines.render()
if __name__ == ‘__main__‘:
location_name_list = [‘北京‘, ‘郑州‘, ‘盐城‘, ‘高雄‘, ‘广州‘, ‘三亚‘, ‘成都‘, ‘拉萨‘, ‘乌鲁木齐‘, ‘银川‘,
‘呼和浩特‘, ‘漠河‘, ‘哈尔滨‘, ‘长春‘, ‘沈阳‘, ‘北京‘]
geo_cities_coords = {}
for location in location_name_list:
print(location)
lat_long = get_location_coordinate(location)
geo_cities_coords[location] = list(lat_long)
plotting_data = []
for i in range(len(location_name_list)):
if i < len(location_name_list)-1:
plotting_data.append((location_name_list[i], location_name_list[i+1]))
# 绘制动态图
plot_geolines(plotting_data, geo_cities_coords)
print(‘ok,去浏览器看看吧‘)

标签:网上 com echarts yun service 等等 效果 ffd json
原文地址:https://www.cnblogs.com/shiwanghualuo/p/13053605.html