标签:聚类 arp nbsp 命令 图例 image 路径 ble col
经常会想到用热图来展示某个基因或某些基因的表达量问题,今天用R中pheatmap包一步步绘制热图。
第一步:公众路径设置,调用包pheatmap,读取目的文件,查看文件。
 1 rm(list=ls())
 2 setwd("D:/VIP/ARSTUDYLOCATION/heatmap/heatmap/")
 3 getwd()
 4
 5 library(pheatmap)
 6 library(ggplot2)
 7
 8 data <- read.table("test.FPKM.txt",header=T,row.names=1,sep="\t")
 9 dim(data)
10 head(data)
第二步:逐步深入绘制热图(图1-图15)
一建热图(图1)
p<-pheatmap(data)
设置标准化方向scale,对其横向标准化
p<-pheatmap(data,scale="row")
设置边框为白色,横向纵向聚类为无;border="white;cluster_cols = F;cluster_rows = F
p<-pheatmap(data,scale="row",border="white",cluster_cols = F,cluster_rows = F)
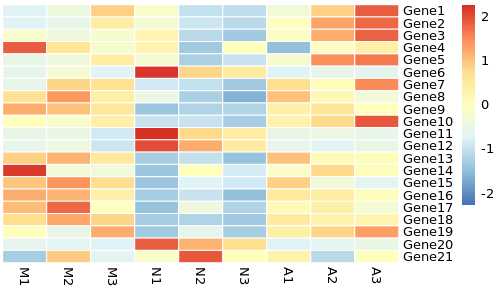
图1
去掉横纵坐标中的id;show_rownames = F,show_colnames = F(图2)
p<-pheatmap(data,scale="row",show_rownames = F,show_colnames = F,border="white",cluster_cols = F,cluster_rows = F)
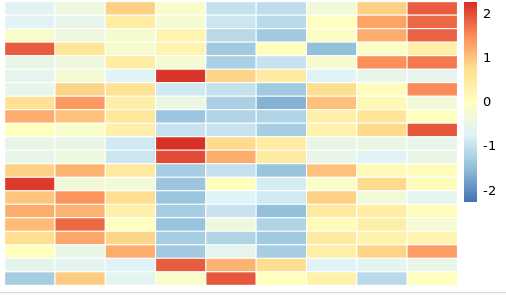
图2 去掉横轴和纵轴的名称
去掉右上角图例;legend = F(图3)
p<-pheatmap(data,scale="row",show_rownames = F,show_colnames = F,legend = F,border="white",cluster_cols = F,cluster_rows = F)
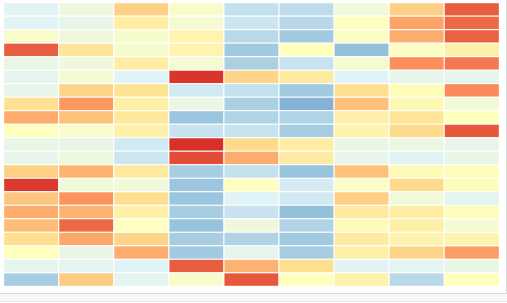
图3 将右上角的图例去掉
设置右上角图例的范围;legend_breaks=c(-1,1)(图4)
p<-pheatmap(data,scale="row",legend_breaks=c(-1,0,1),show_rownames = F,show_colnames = F,legend = T,border="white",cluster_cols = F,cluster_rows = F)
p<-pheatmap(data,scale="row",legend_breaks=c(-2,0,2),show_rownames = F,show_colnames = F,legend = T,border="white",cluster_cols = F,cluster_rows = F)
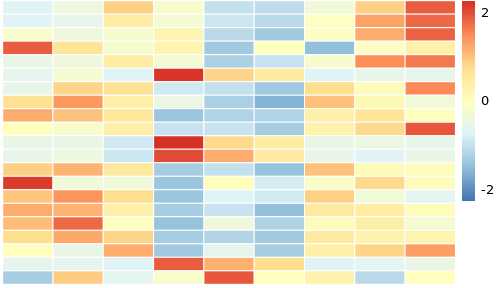
图4 更改图例范围
设置图中字的大小;fondsize(图5)
#图表字体:命令:fondsize=2/8
p<-pheatmap(data,scale="row",fontsize = 2,show_rownames = T,show_colnames = T,legend = F,border="white",cluster_cols = F,cluster_rows = F)
p2<-pheatmap(data,scale="row",fontsize = 8,show_rownames = T,show_colnames = T,legend = F,border="white",cluster_cols = F,cluster_rows = F)
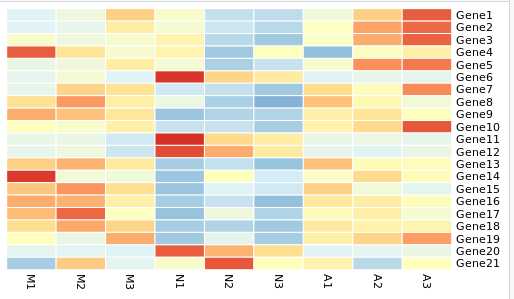
图5 设置字的大小
改变横向和纵向字体大小;fontsize_row = 8,fontsize_col=12 (图6)
p<-pheatmap(data,scale="row",fontsize_row = 8,fontsize_col = 12,show_rownames = T,show_colnames = T,legend=T,border="white",cluster_cols = T,cluster_rows = T)
p<-pheatmap(data,scale="row",fontsize_row = 12,fontsize_col = 8,show_rownames = T,show_colnames = T,legend=T,border="white",cluster_cols = T,cluster_rows = T)
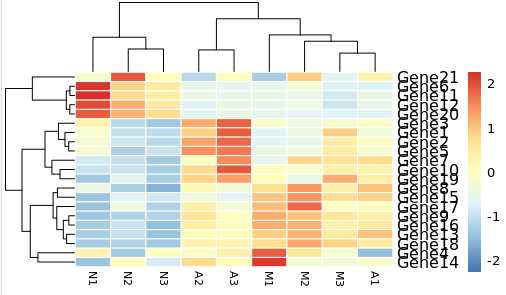
图6 改变横向和纵向字体的大小
设置横向纵向的树高;treeheight_col = 20,treeheight_row = 15(图7)
p<-pheatmap(data,scale="row",border="white",cluster_cols = T,treeheight_col = 20,cluster_rows = T,treeheight_row = 15)
p<-pheatmap(data,scale="row",border="white",cluster_cols = T,treeheight_col = 20,cluster_rows = T,treeheight_row = 20)
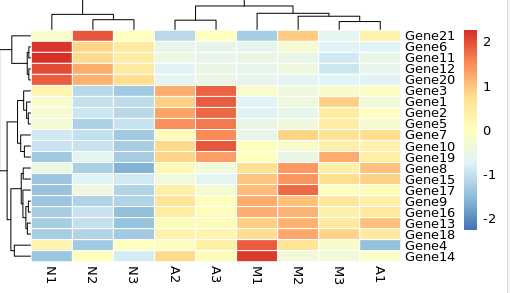
图7 设置横向和纵向聚类热图的树形高度
标签:聚类 arp nbsp 命令 图例 image 路径 ble col
原文地址:https://www.cnblogs.com/smyang/p/12833694.html