标签:技术 inf mic sub nump plt grid load mamicode
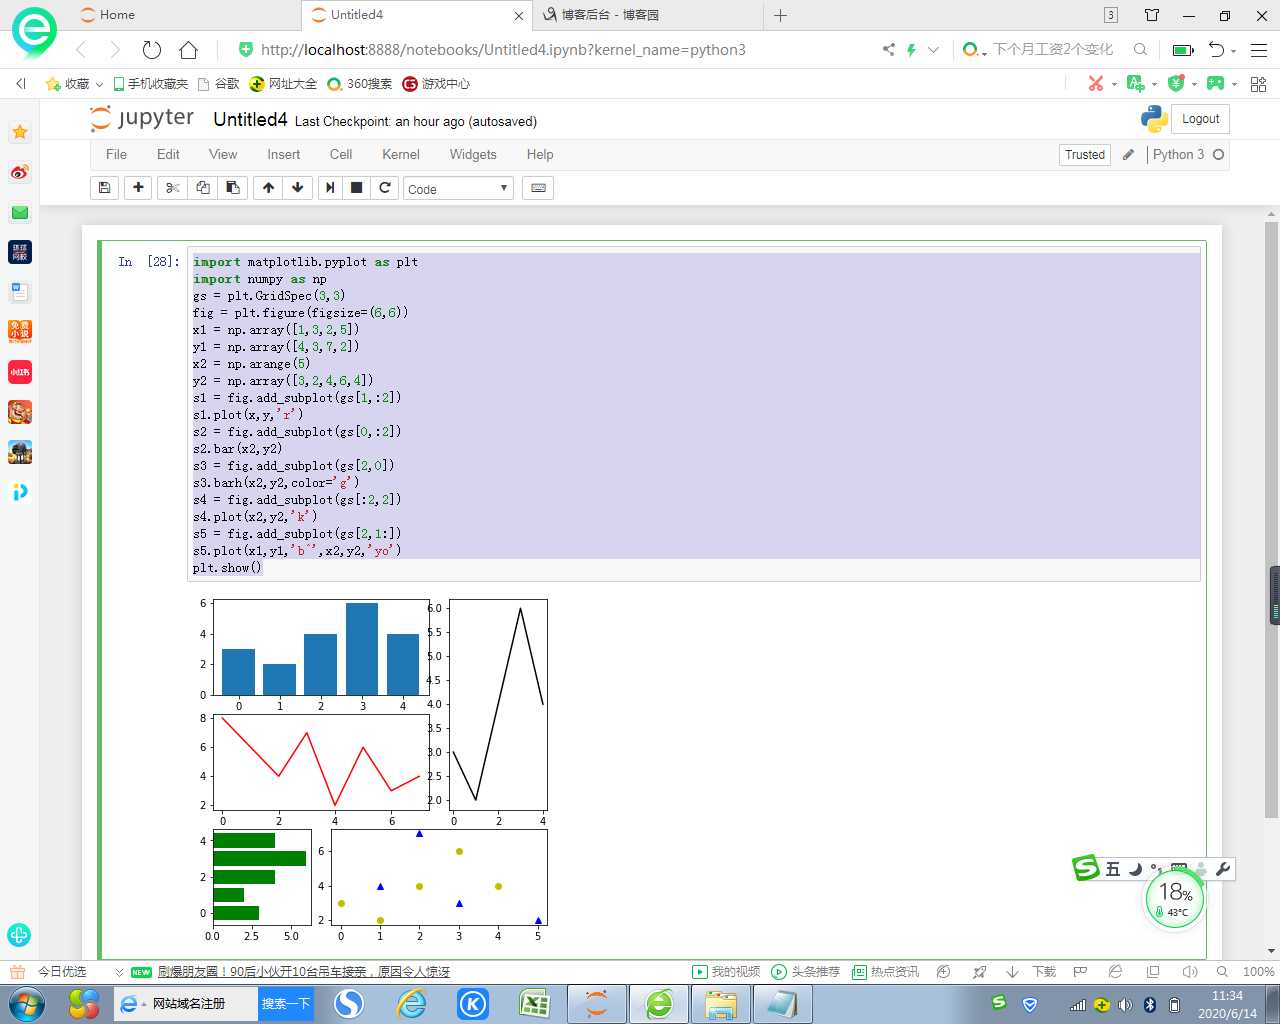
import matplotlib.pyplot as plt
import numpy as np
gs = plt.GridSpec(3,3)
fig = plt.figure(figsize=(6,6))
x1 = np.array([1,3,2,5])
y1 = np.array([4,3,7,2])
x2 = np.arange(5)
y2 = np.array([3,2,4,6,4])
s1 = fig.add_subplot(gs[1,:2])
s1.plot(x,y,‘r‘)
s2 = fig.add_subplot(gs[0,:2])
s2.bar(x2,y2)
s3 = fig.add_subplot(gs[2,0])
s3.barh(x2,y2,color=‘g‘)
s4 = fig.add_subplot(gs[:2,2])
s4.plot(x2,y2,‘k‘)
s5 = fig.add_subplot(gs[2,1:])
s5.plot(x1,y1,‘b^‘,x2,y2,‘yo‘)
plt.show()

标签:技术 inf mic sub nump plt grid load mamicode
原文地址:https://www.cnblogs.com/wei23/p/13124198.html