标签:turn 最好 int 导入 col open 参数 label info
首先,导入一组数据,代码如下:
import numpy as np
import matplotlib.pyplot as plt

x, y = [], []
for sample in open("../_Data/prices.txt", "r"):
    _x, _y = sample.split(",")
    x.append(float(_x))
    y.append(float(_y))
x, y = np.array(x), np.array(y)
x = (x - x.mean()) / x.std()
plt.figure()
plt.scatter(x, y, c="g", s=6)
plt.show()
其中对导入数据进行处理:
x.mean()是平均值,x.std()是标准差
def get_model(deg):
    return lambda input_x=x0: np.polyval(np.polyfit(x, y, deg), input_x)
 # 根据参数n、输入的x、y返回相对应的损失
def get_cost(deg, input_x, input_y):
    return 0.5 * ((get_model(deg)(input_x) - input_y) ** 2).sum()
test_set = (1,2,3,4)
for d in test_set:
# 输出相应的损失
    print(get_cost(d, x, y))

 # 画出相应的图像
plt.scatter(x, y, c="g", s=20)
for d in test_set:
    plt.plot(x0, get_model(d)(), label="degree = {}".format(d))
# 将横轴、纵轴的范围分别限制在(-2,4)、(〖10〗^5,8×〖10〗^5)
plt.xlim(-2, 4)
plt.ylim(1e5, 8e5)
# 调用legend方法使曲线对应的label正确显示
plt.legend()
plt.show()
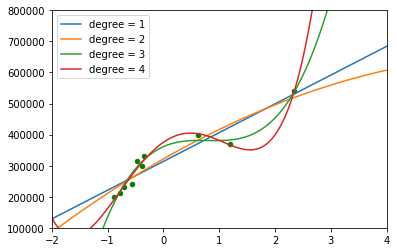
应用如下模型对多项式进行拟合:

以下是拟合的结果,从图像中能得出,n取3时效果最好

标签:turn 最好 int 导入 col open 参数 label info
原文地址:https://www.cnblogs.com/fengxiaokang/p/13125792.html