标签:weight 绘图 otto 清晰度 save 宽高 plt code 描述
from matplotlib import pyplot as plt
import matplotlib
from matplotlib import font_manager
font = {‘family‘: ‘Microsoft YaHei‘,
‘weight‘: ‘bold‘,
‘size‘: ‘12‘}
matplotlib.rc(‘font‘, **font)
# 设置字体,第一种方法
# myfont = font_manager.FontProperties(family=‘Microsoft YaHei‘)
# 另一种设置字体的方式
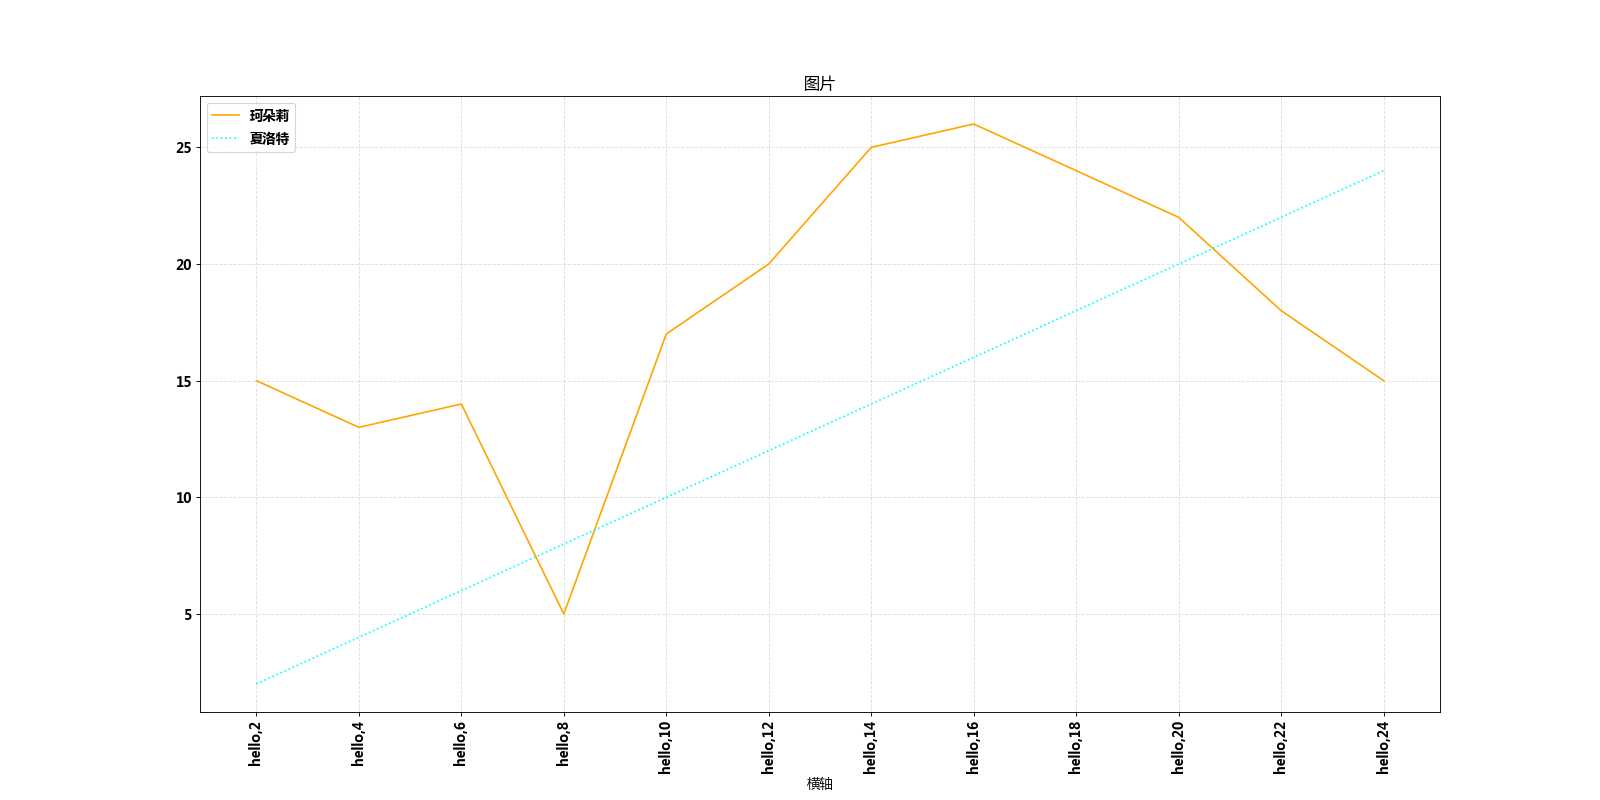
x = range(2, 26, 2)
y = [15, 13, 14, 5, 17, 20, 25, 26, 24, 22, 18, 15]
y1 = [i for i in range(2, 25, 2)]
fig = plt.figure(figsize=(20, 8), dpi=80)
# figsize控制图片大小(宽,高)
# dpi控制图像清晰度
plt.plot(x, y, label=‘珂朵莉‘, color=‘orange‘, linestyle=‘-‘)
plt.plot(x, y1, label=‘夏洛特‘, color=‘cyan‘, linestyle=‘:‘)
# 绘图
_x = x
_xtick_labels = [‘hello,{}‘.format(i) for i in _x]
# 设置x轴名称
plt.xticks(x, _xtick_labels, rotation=90)
# 设置x轴刻度,刻度旋转90度
plt.xlabel(‘横轴‘)
# 添加描述信息
plt.title(‘图片‘)
# 设置标题
plt.grid(alpha=0.4, linestyle=‘--‘)
# 回绘制网格,透明度为0.4
plt.legend(prop=font, loc=‘upper left‘)
# 添加图例,显示在左上角
plt.savefig(‘sig.png‘)
# 保存图片
plt.show()
# 展示图片
# 5
# 散点图
from matplotlib import pyplot as plt
import matplotlib
font = {‘family‘: ‘Microsoft YaHei‘,
‘weight‘: ‘bold‘,
‘size‘: ‘12‘}
matplotlib.rc(‘font‘, **font)
plt.figure(figsize=(20, 8), dpi=90)
# 设置图形大小
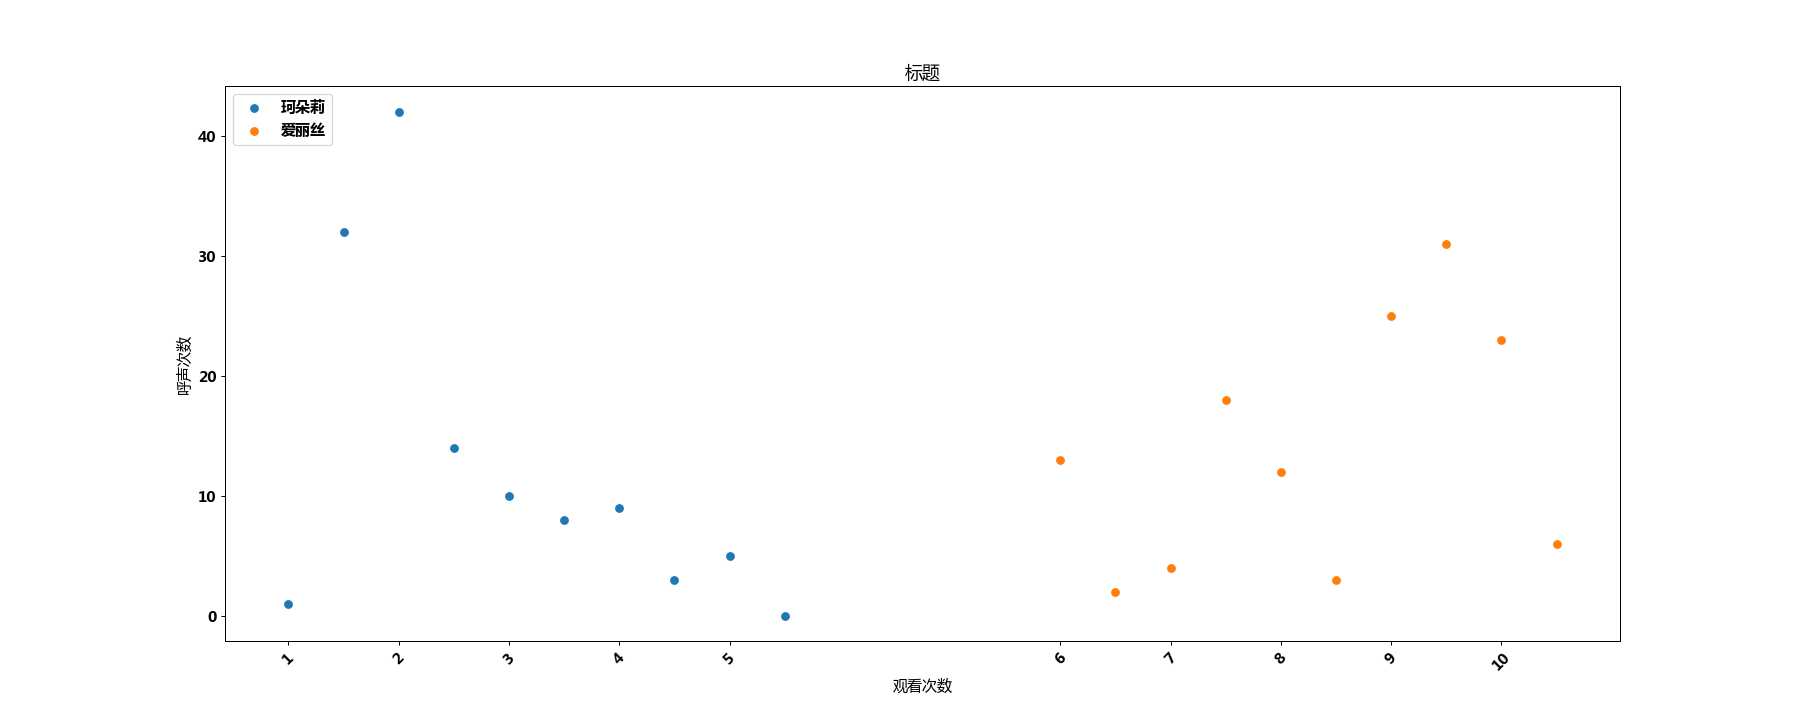
x1 = range(1, 11)
x2 = range(15, 25)
y1 = [1, 32, 42, 14, 10, 8, 9, 3, 5, 0]
y2 = [13, 2, 4, 18, 12, 3, 25, 31, 23, 6]
plt.scatter(x1, y1, label=‘珂朵莉‘)
plt.scatter(x2, y2, label=‘爱丽丝‘)
# 绘制散点图
_x = list(x1) + list(x2)
_xtick_labels = [i for i in _x]
plt.xticks(_x[::2], _xtick_labels, rotation=45)
# 调整x轴的刻度
# 添加图例
plt.legend(loc=‘upper left‘)
plt.xlabel(‘观看次数‘)
plt.ylabel(‘呼声次数‘)
plt.title(‘标题‘)
plt.savefig(‘sig2.png‘)
# 横着保存
plt.show()
# 条形图
from matplotlib import pyplot as plt
import matplotlib
font = {‘family‘: ‘Microsoft YaHei‘,
‘weight‘: ‘bold‘,
‘size‘: ‘12‘}
matplotlib.rc(‘font‘, **font)
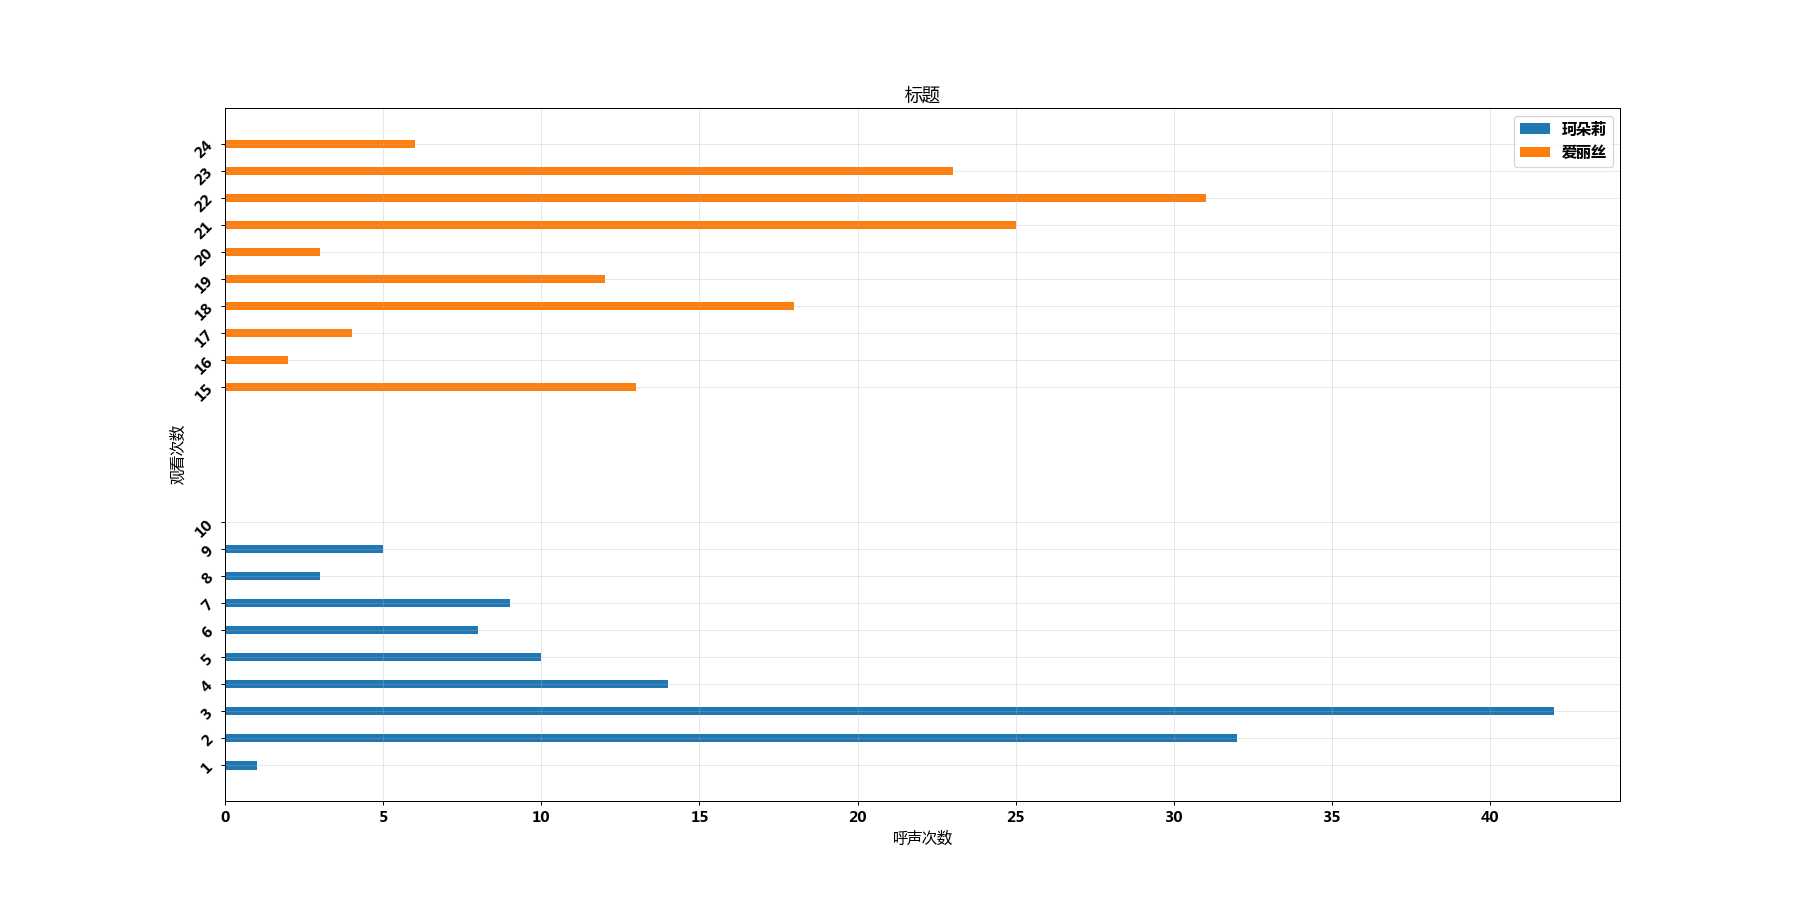
x1 = range(1, 11)
x2 = range(15, 25)
y1 = [1, 32, 42, 14, 10, 8, 9, 3, 5, 0]
y2 = [13, 2, 4, 18, 12, 3, 25, 31, 23, 6]
# plt.bar(x1, y1, width=0.3, label=‘珂朵莉‘)
# plt.bar(x2, y2, width=0.3, label=‘爱丽丝‘)
# 纵向显示
# _x = list(x1) + list(x2)
# _xtick_labels = [i for i in _x]
# plt.xticks(_x, _xtick_labels, rotation=45)
# 调整x轴的刻度
plt.figure(figsize=(20, 10), dpi=90)
plt.barh(x1, y1, height=0.3, label=‘珂朵莉‘)
plt.barh(x2, y2, height=0.3, label=‘爱丽丝‘)
# 横向显示
_x = list(x1) + list(x2)
_xtick_labels = [i for i in _x]
plt.yticks(_x, _xtick_labels, rotation=45)
# 调整y轴的刻度
# 添加图例
plt.legend(loc=‘upper right‘)
plt.ylabel(‘观看次数‘)
plt.xlabel(‘呼声次数‘)
plt.title(‘标题‘)
# plt.savefig(‘sig3.png‘)
# 横着保存
plt.grid(alpha=0.3)
plt.savefig(‘sig3h.png‘)
# 纵着保存
plt.show()
# 12
# 直方图
from matplotlib import pyplot as plt
import matplotlib
font = {‘family‘: ‘Microsoft YaHei‘,
‘weight‘: ‘bold‘,
‘size‘: ‘12‘}
matplotlib.rc(‘font‘, **font)
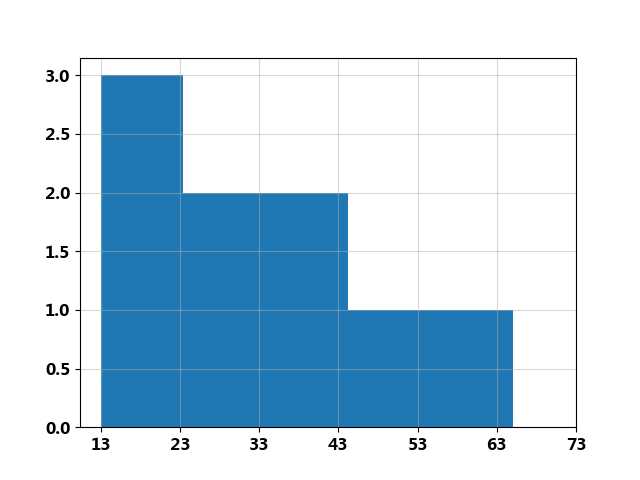
a = [20, 20, 43, 45, 65, 30, 40, 25, 13]
# 计算组数
d = 10 # 组距
num_bins = (max(a) - min(a))//d
plt.hist(a, num_bins)
plt.xticks(range(min(a), max(a)+d, d))
plt.grid(alpha=0.5)
plt.savefig(‘sig4.png‘)
plt.show()
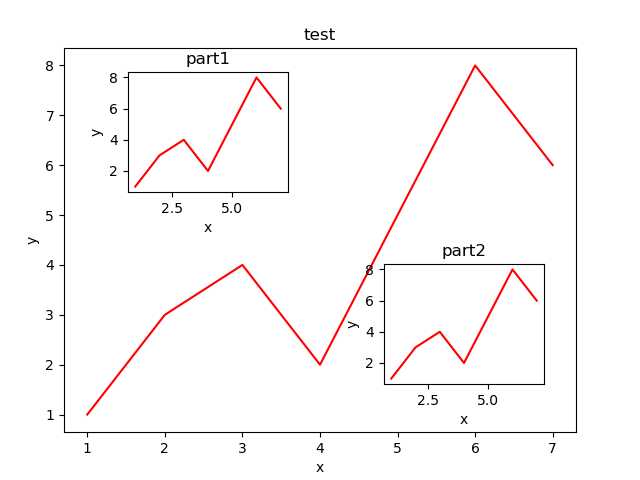
import matplotlib.pyplot as plt

# 定义figure
fig = plt.figure()

# 定义数据
x = [1, 2, 3, 4, 5, 6, 7]
y = [1, 3, 4, 2, 5, 8, 6]

# figure的百分比, 从figure 10%的位置开始绘制, 宽高是figure的80%
left, bottom, width, height = 0.1, 0.1, 0.8, 0.8
# 获得绘制的句柄
ax1 = fig.add_axes([left, bottom, width, height])
# 绘制点(x,y)
ax1.plot(x, y, ‘r‘)
ax1.set_xlabel(‘x‘)
ax1.set_ylabel(‘y‘)
ax1.set_title(‘test‘)


# 嵌套方法一
# figure的百分比, 从figure 10%的位置开始绘制, 宽高是figure的80%
left, bottom, width, height = 0.2, 0.6, 0.25, 0.25
# 获得绘制的句柄
ax2 = fig.add_axes([left, bottom, width, height])
# 绘制点(x,y)
ax2.plot(x, y, ‘r‘)
ax2.set_xlabel(‘x‘)
ax2.set_ylabel(‘y‘)
ax2.set_title(‘part1‘)


# 嵌套方法二
plt.axes([bottom, left, width, height])
plt.plot(x, y, ‘r‘)
plt.xlabel(‘x‘)
plt.ylabel(‘y‘)
plt.title(‘part2‘)

plt.savefig(‘sig5.png‘)

plt.show()
更多文档图例:https://www.matplotlib.org.cn/gallery/index.html
标签:weight 绘图 otto 清晰度 save 宽高 plt code 描述
原文地址:https://www.cnblogs.com/superSmall/p/13179250.html