标签:edit htm trigger cat gap UNC png show att
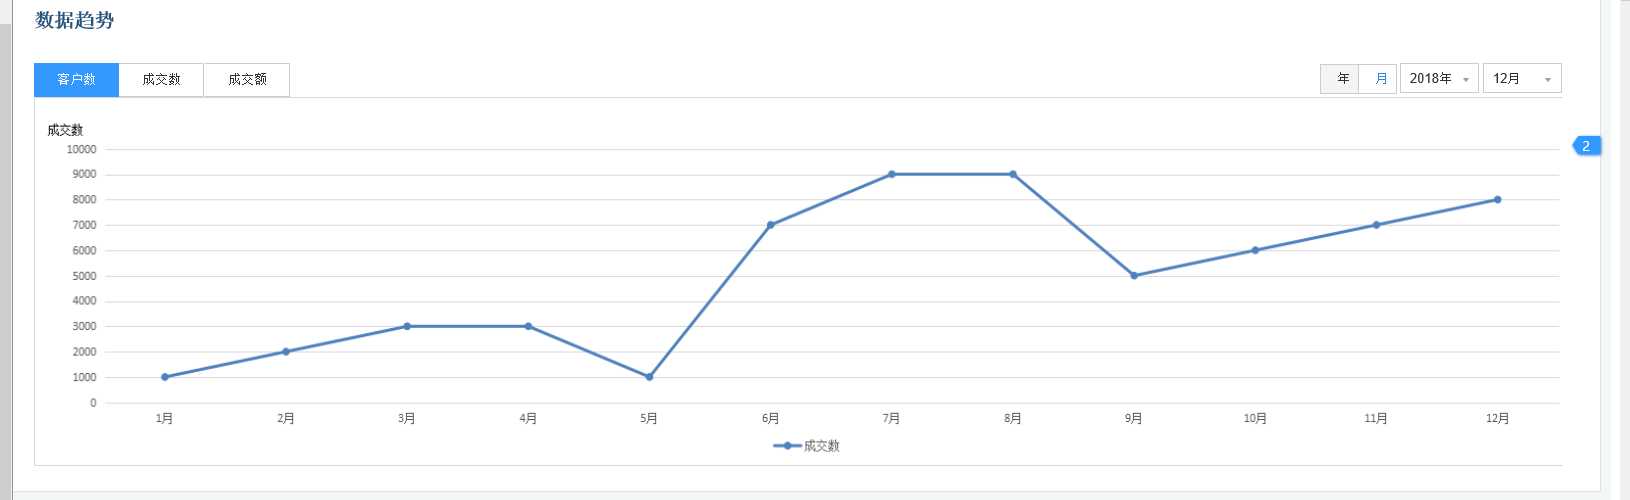
需求有个折线图,用 echarts 画一下:
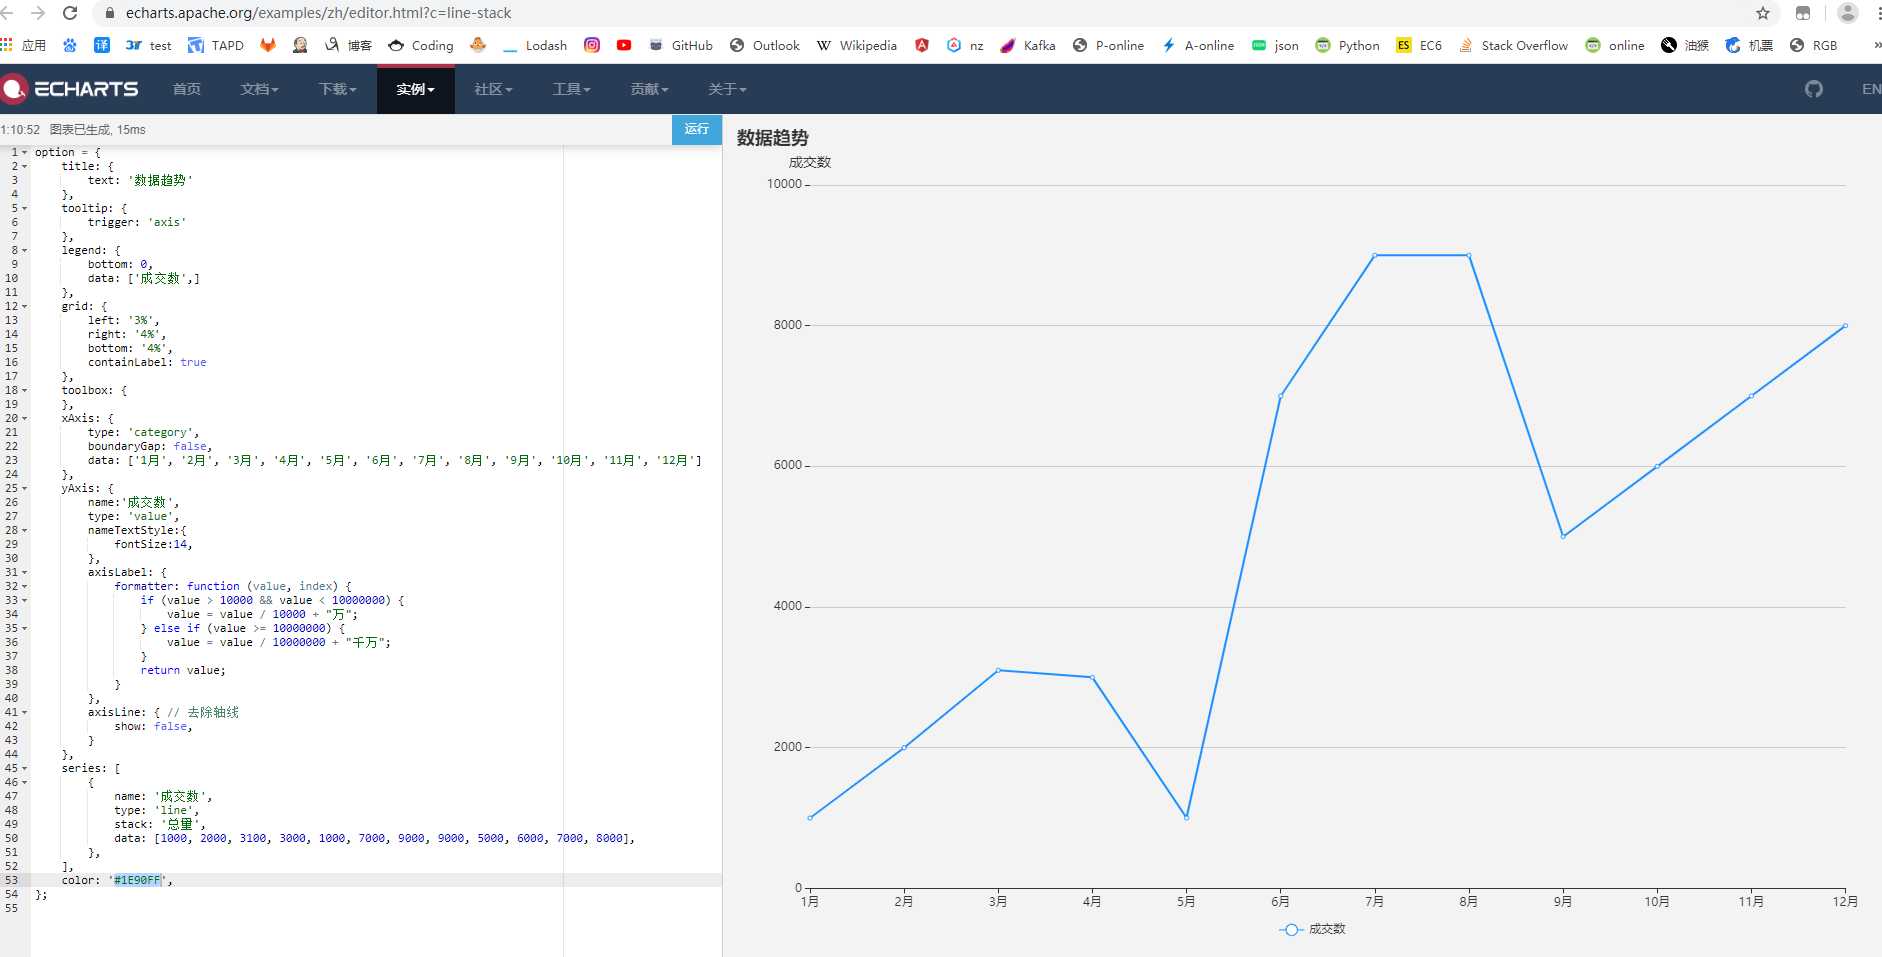
上个测试连接:https://echarts.apache.org/examples/zh/editor.html?c=line-stack
记录下
option = {
    title: {
        text: ‘数据趋势‘
    },
    tooltip: {
        trigger: ‘axis‘
    },
    legend: {
        bottom: 0,
        data: [‘成交数‘,]
    },
    grid: {
        left: ‘3%‘,
        right: ‘4%‘,
        bottom: ‘4%‘,
        containLabel: true
    },
    toolbox: {
    },
    xAxis: {
        type: ‘category‘,
        boundaryGap: false,
        data: [‘1月‘, ‘2月‘, ‘3月‘, ‘4月‘, ‘5月‘, ‘6月‘, ‘7月‘, ‘8月‘, ‘9月‘, ‘10月‘, ‘11月‘, ‘12月‘]
    },
    yAxis: {
        name:‘成交数‘,
        type: ‘value‘,
        nameTextStyle:{
            fontSize:14,
        },
        axisLabel: {
            formatter: function (value, index) {
                if (value > 10000 && value < 10000000) {
                    value = value / 10000 + "万";
                } else if (value >= 10000000) {
                    value = value / 10000000 + "千万";
                }
                return value;
            }
        },
        axisLine: { // 去除轴线
            show: false,
        }
    },
    series: [
        {
            name: ‘成交数‘,
            type: ‘line‘,
            stack: ‘总量‘,
            data: [1000, 2000, 3100, 3000, 1000, 7000, 9000, 9000, 5000, 6000, 7000, 8000],
        },
    ],
    color: ‘#1E90FF‘,
};
标签:edit htm trigger cat gap UNC png show att
原文地址:https://www.cnblogs.com/guofan/p/13186583.html