标签:depend cti ola dig 最大值 clust dep local google
1. Graph concepts
One interactive website: https://d3gt.com/unit.html
Graphs
- a graph G = (V,E), consisting of a finite nonempty set V of vertices or nodes, and a set E ? V × V of edges consisting of unordered pairs of vertices.
weighted graph 里 对于每一条边 (vi, vi) ∈ E 都有一个相对应的 weight wij
- (vi, vi) : loop, 一个没有loop的无向图叫 simple graph.
- (vi, vj) : 这两个node称作 neighbors,且互为adjacent. 在有向图中, 这个有向的edge 可被称为 arc,vi 为tail, vj为head
- |V| = n, the number of nodes in G, 也叫做 order of the graph.
- |E| = m, the number of edges in G, 也叫做 size of the graph. 比如下图中 order = 6, size = 5

Subgraphs
- A subgraph G‘ of a graph G is a graph G‘ whose vertex set and edge set are subsets of those of G. If G‘ is a subgraph of G, then G is said to be a supergraph of G‘ (Harary 1994, p. 11).
- A (sub)graph is called complete (or a clique) if there exists an edge between all pairs of nodes.
Degree
- Degree of vertice 就是有多少个连着它,denoted by deg (v), minimum degree 用 δ(G), maximum 用 ?(G). 为了避免混淆,前面那个叫small delta, 后面是 big delta. 注意分清哪个是G哪个是V的属性
- vi ∈ V , denoted as d(vi) or just di
- Degree sequence 就是这些nodes的degrees的一个列表,如下图,Degree Sequence = (5,4,4,4,4,4,1)

- for directed graphs, indegree 写成 id(vi), 就是以该点为head的连线数量,outdegree od(vi), the number of outgoing edges from vi
Path and Distance
- A walk in a graph G between nodes x and y is an ordered sequence of vertices, starting at x and ending at y.
- The length of the walk, t, is measured in terms of hops – the number of edges along the walk
- A trail 不重复edges
- A path 不重复vertices (除首尾巴)
- A cycle 一个closed trail ≥ 3,开头结尾都是同一个点 且nodes不重复
- The distance between two vertices in a graph is the number of edges in a shortest or minimal path.
Connectedness
- if there exists a path between them 就叫connected了
一个栗子:
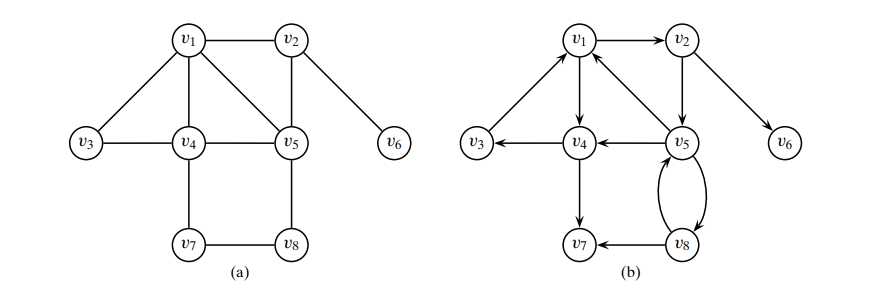
- The degree sequence of the graph is (4,4,4,3,2,2,2,1), and therefore its degree frequency distribution is given as (N0,N1,N2,N3,N4) = (0,1,3,1,3),
The degree distribution is given as (f (0),f (1),f (2),f (3),f (4))= (0,0.125,0.375,0.125,0.375)
- 对于(b)图, The indegree of v7 is id(v7) = 2, whereas its outdegree is od(v7) = 0.
Adjacency matrix
- A graph G = (V,E), with |V| = n vertices, can be conveniently represented in the form of an n × n, symmetric binary adjacency matrix, A
- 当有向时,这个矩阵不对称
Graphs from data matrix
- 这里讲的是把data转变为需要的graph形式,也就是找一个weighted graph来放下 有着n个点的d-维空间的dataset 然后通过一些similarity的distance的算法 来映射,把这个matrix转变成一个binary
2. Topological attributes
只能应用在单个点或边的attributes是local 能用在整个图叫 global
Degree (local)
Average degree:

Average path length (also called characteristic path length)
For a connected graph:

Eccentricity (local)
- defined as the maximum distance of one vertex from other vertex. denoted by e(V)

Radius and diameter
- 对于disconnected graph,看的都是all the connected components
- radius, r(G):

- Diameter, d(G):

- 当然这个d对一些异常值挺敏感,所以引入 effective diameter,也就是设定一个minimum number of hops 让这个范围内的所有连接点都可以任意链接到, say:
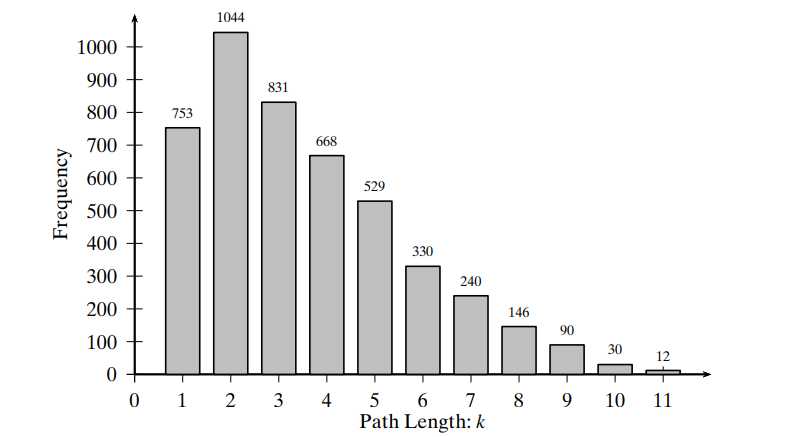
- 这个图里 94%的pairs of nodes 落在了7步以内,所以可以说 effective diameter 是 7.
Clustering coefficient
Efficiency
- The efficiency for a pair of nodes vi and vj is defined as 1/d(vi,vj). 如果两个点不相连,那么d无限大也就是efficiency为0,两者间距离越小,越efficient
- Efficiency for a graph G, is the average efficiency over all pairs of nodes, whether connected or not, given as:

举个栗子,用上面那个图,
求node v4,整个graph的clustering coefficient 以及 v4 的local efficiency
知 一个点的cc和 与它连接的neighbor们所产生的subgraph有关,即用subgraph中实际的边数 除以 maximum number边数。而一个 graph 的cc 就只是简单的对图中每个点的 cc进行平均,
通过下图:

可以得到 C(v4) = 2/6 = 0.33, C(G) = 1/8 * (1/2 +1/3 +1 + 1/3 + 1/3 + 0 + 0 +0 )= 0.3125
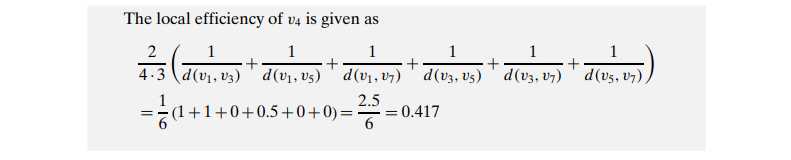
而local efficiency用上面的公式:
3. Centrality analysis
- Centrality measures have typically been used as indicators of power, influence, popularity and prestige.
3.1 Basic centralities
Degree Centrality
Eccentricity centrality
- less eccentric, more central. 也就是看最大的distance(也就是length of shortest path) 是什么 然后取倒数
- center node: 当等于radius时;等于diameter时 称作periphery node (适合医院选址问题)

Closeness Centrality
- Uses the sum of all the distances to rank how central a node is.
- smallest total distance, median node
- For comparison purpose, we can standardize the closeness by dividing by the maximum possible value 1/(n ? 1)
- The more central a node is, the lower its total distance to all other nodes.

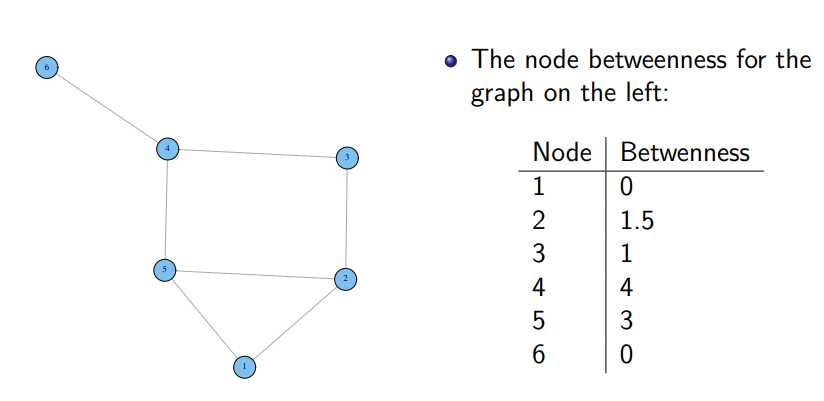
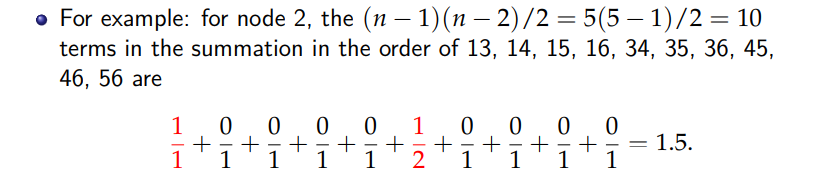
Betweenness centrality
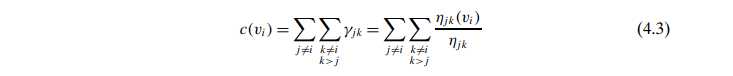
- measures how many shortest paths between all pairs of vertices
- 首先计算 某两个点间 shortest paths的数量,然后计算通过given vertex的paths的数量,计算fraction (注意这里的jk选取时是不考虑i的)
计算betweenness的栗子 (http://www2.unb.ca/~ddu/6634/Lecture_notes/Lecture_4_centrality_measure.pdf):
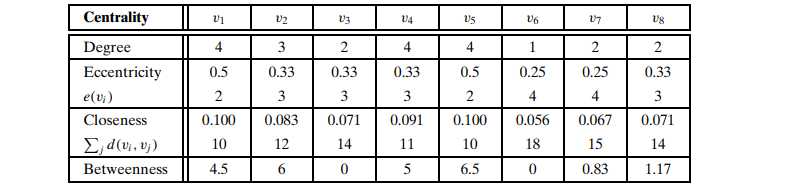
再用之前那个graph计算各点的中心度:
3.2 Web centralities
web里很多主要指的是有向网
Prestige score (eigenvector centrality)
- As a centrality, prestige is supposed to be a measure of the importance or rank of a node/ the influence of a node in a network
- A high eigenvector score means that a node is connected to many nodes who themselves have high scores
- 也就是看谁给的最多 或者 谁收到的最多
- 简而言之就是提取点点之间的关系矩阵转换成一个等价最显著的特征向量 从而进行比较,具体的策略是:
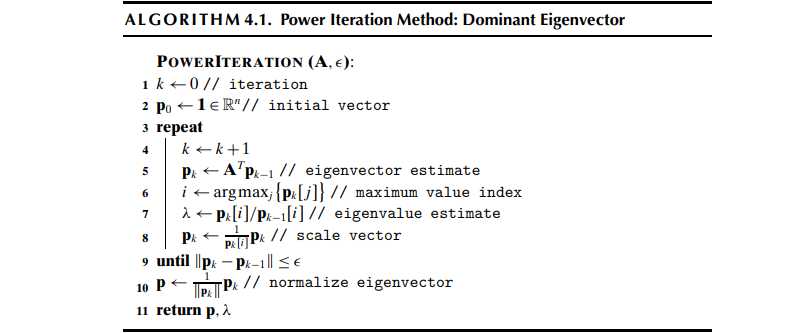
举个例子:给一个有5个node,也就是 5*5的关系矩阵求值 Starting with an initial prestige vector p0=(1,1,1,1,1)T,
每次iterate后 都用vector中得到的最大值 进行 scale。每次iterate之后的 vector p 比上前一次的 vector 得到 λ, 也就是特征值
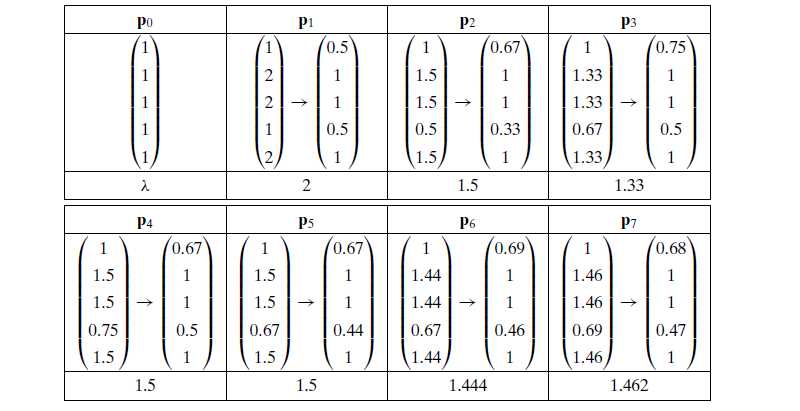
经过多次iterations之后,λ会稳定在某一个值,如下图:
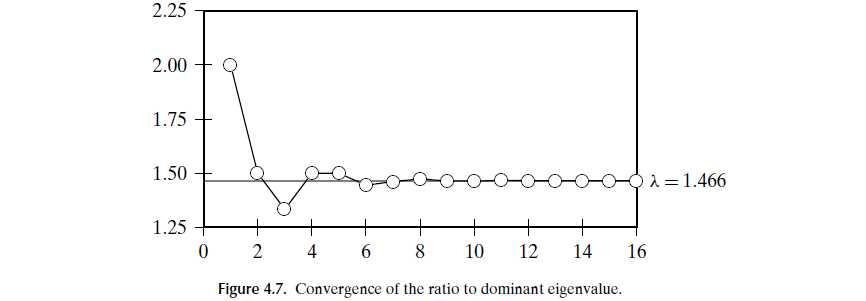
我们再把它normalize成单位向量,就可以得到 dominant eigenvector,比较结果vector中 哪个点的值更大,就可以说哪个更prestige一点
Random jumps
- 指的是random surfing中 就算点与点之间没有联系 但还是可能会从这里跳到那里去
Page rank
- a method for computing the prestige or centrality of nodes in the context of Web search.
- 用了 random surfing 的假设,也就是人们会随机点开这些links
- The PageRank of a Web page is defined to be the probability of a random web surfer landing at that page.
Normalized Prestige
-
也就是考虑了random jumps 这个点跳到另一个点outdegree的几率 (多除了一个)For the random surfer matrix, the outdegree of each node is od(u) = n

-
so far, PageRank vector is essentially a normalized prestige vector.
举个例子,依旧以上面那5个点的adjacency list为例,首先是把它normalize:

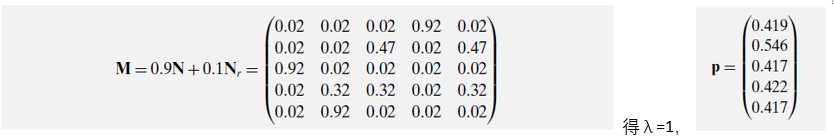
然后 是对random jump normalize(normalized random jump adjacency matrix:

假设这个小概率α = 0.1, 那么总的 normalized adjacency matrix 为 M= 0.9N+0.1Nr =
Hub and Authority Scores
- 这个概念的出现是为了解决web search 的 ranking 问题。又是也当作 Hyperlink Induced Topic Search (HITS) method
- 和pagerank不同的是 引入了两个 two flavors of importance: 含有所需要相关topic信息的 authority 以及 提供了指引导向所需要authority信息的 hub (就比如 某个大学ranking网站为 hub,你想知道的university 是authority)
- The authority score of a page is analogous to PageRank or prestige, and it depends on how many “good” pages point to it. On the other hand, the hub score of a page is based on how many “good” pages it points to.
- 同样的 就可以对每一个网页进行两个score 的 weighting, 一个是 Authority score (a) ,一个是 hub score (h):

计算时像之前那个prestige的例子,先 列出 原关系矩阵,矩阵的转置,然后start with 都是1 的 a 矩阵,相乘后再 用最大值 scale,得到第一个iterate之后的 h vector,接着用 转置矩阵 × 这个 h vector 得到 a,再scale 得到第一个iterate之后的a矩阵 ATA and AAT,不断重复
4. Graph models
常见的三个property
Small-world Property
- average path length μL ∝ logn, n is the number of nodes in the graph
Scale-free Property
- empirical degree distribution f (k) exhibits a scale-free behavior captured by a power-law relationship with k, f (k) ∝ k?γ
Clustering Effect
Erd¨os–R′enyi Random Graph Model
- generates a random graph such that any of the possible graphs with a fixed number of nodes and edges has equal probability of being chosen.
Watts–Strogatz Small-world Graph Model
- Such a network will have a high clustering coefficient, but will not be small-world.
Barab′asi–Albert Scale-free Model
可以看看他写的那本网络科学的书噢
这一part就先到这里 具体的一些theory还有model放在其他的自我梳理环节
Some references
SNA -- 基本的一些图论知识
标签:depend cti ola dig 最大值 clust dep local google
原文地址:https://www.cnblogs.com/ms-jin/p/13266534.html
